Getting the most out of our updated Transactions page
Evan is on the Dashboard Product team at Mercury.
At Mercury, we believe your account should do more than just hold your money — it should help you understand it. That’s why your updated Transactions page now helps you answer key questions — quickly. Things like:
- How much did we burn this month?
- Where’s most of our spend going?
- What are our monthly software subscription costs?
Entrepreneurs and business leaders often toggle between dashboards, spreadsheets, and accounting tools just to get these answers. But now your Transactions page brings everything together — offering a single source of financial truth that allows you to make decisions faster.
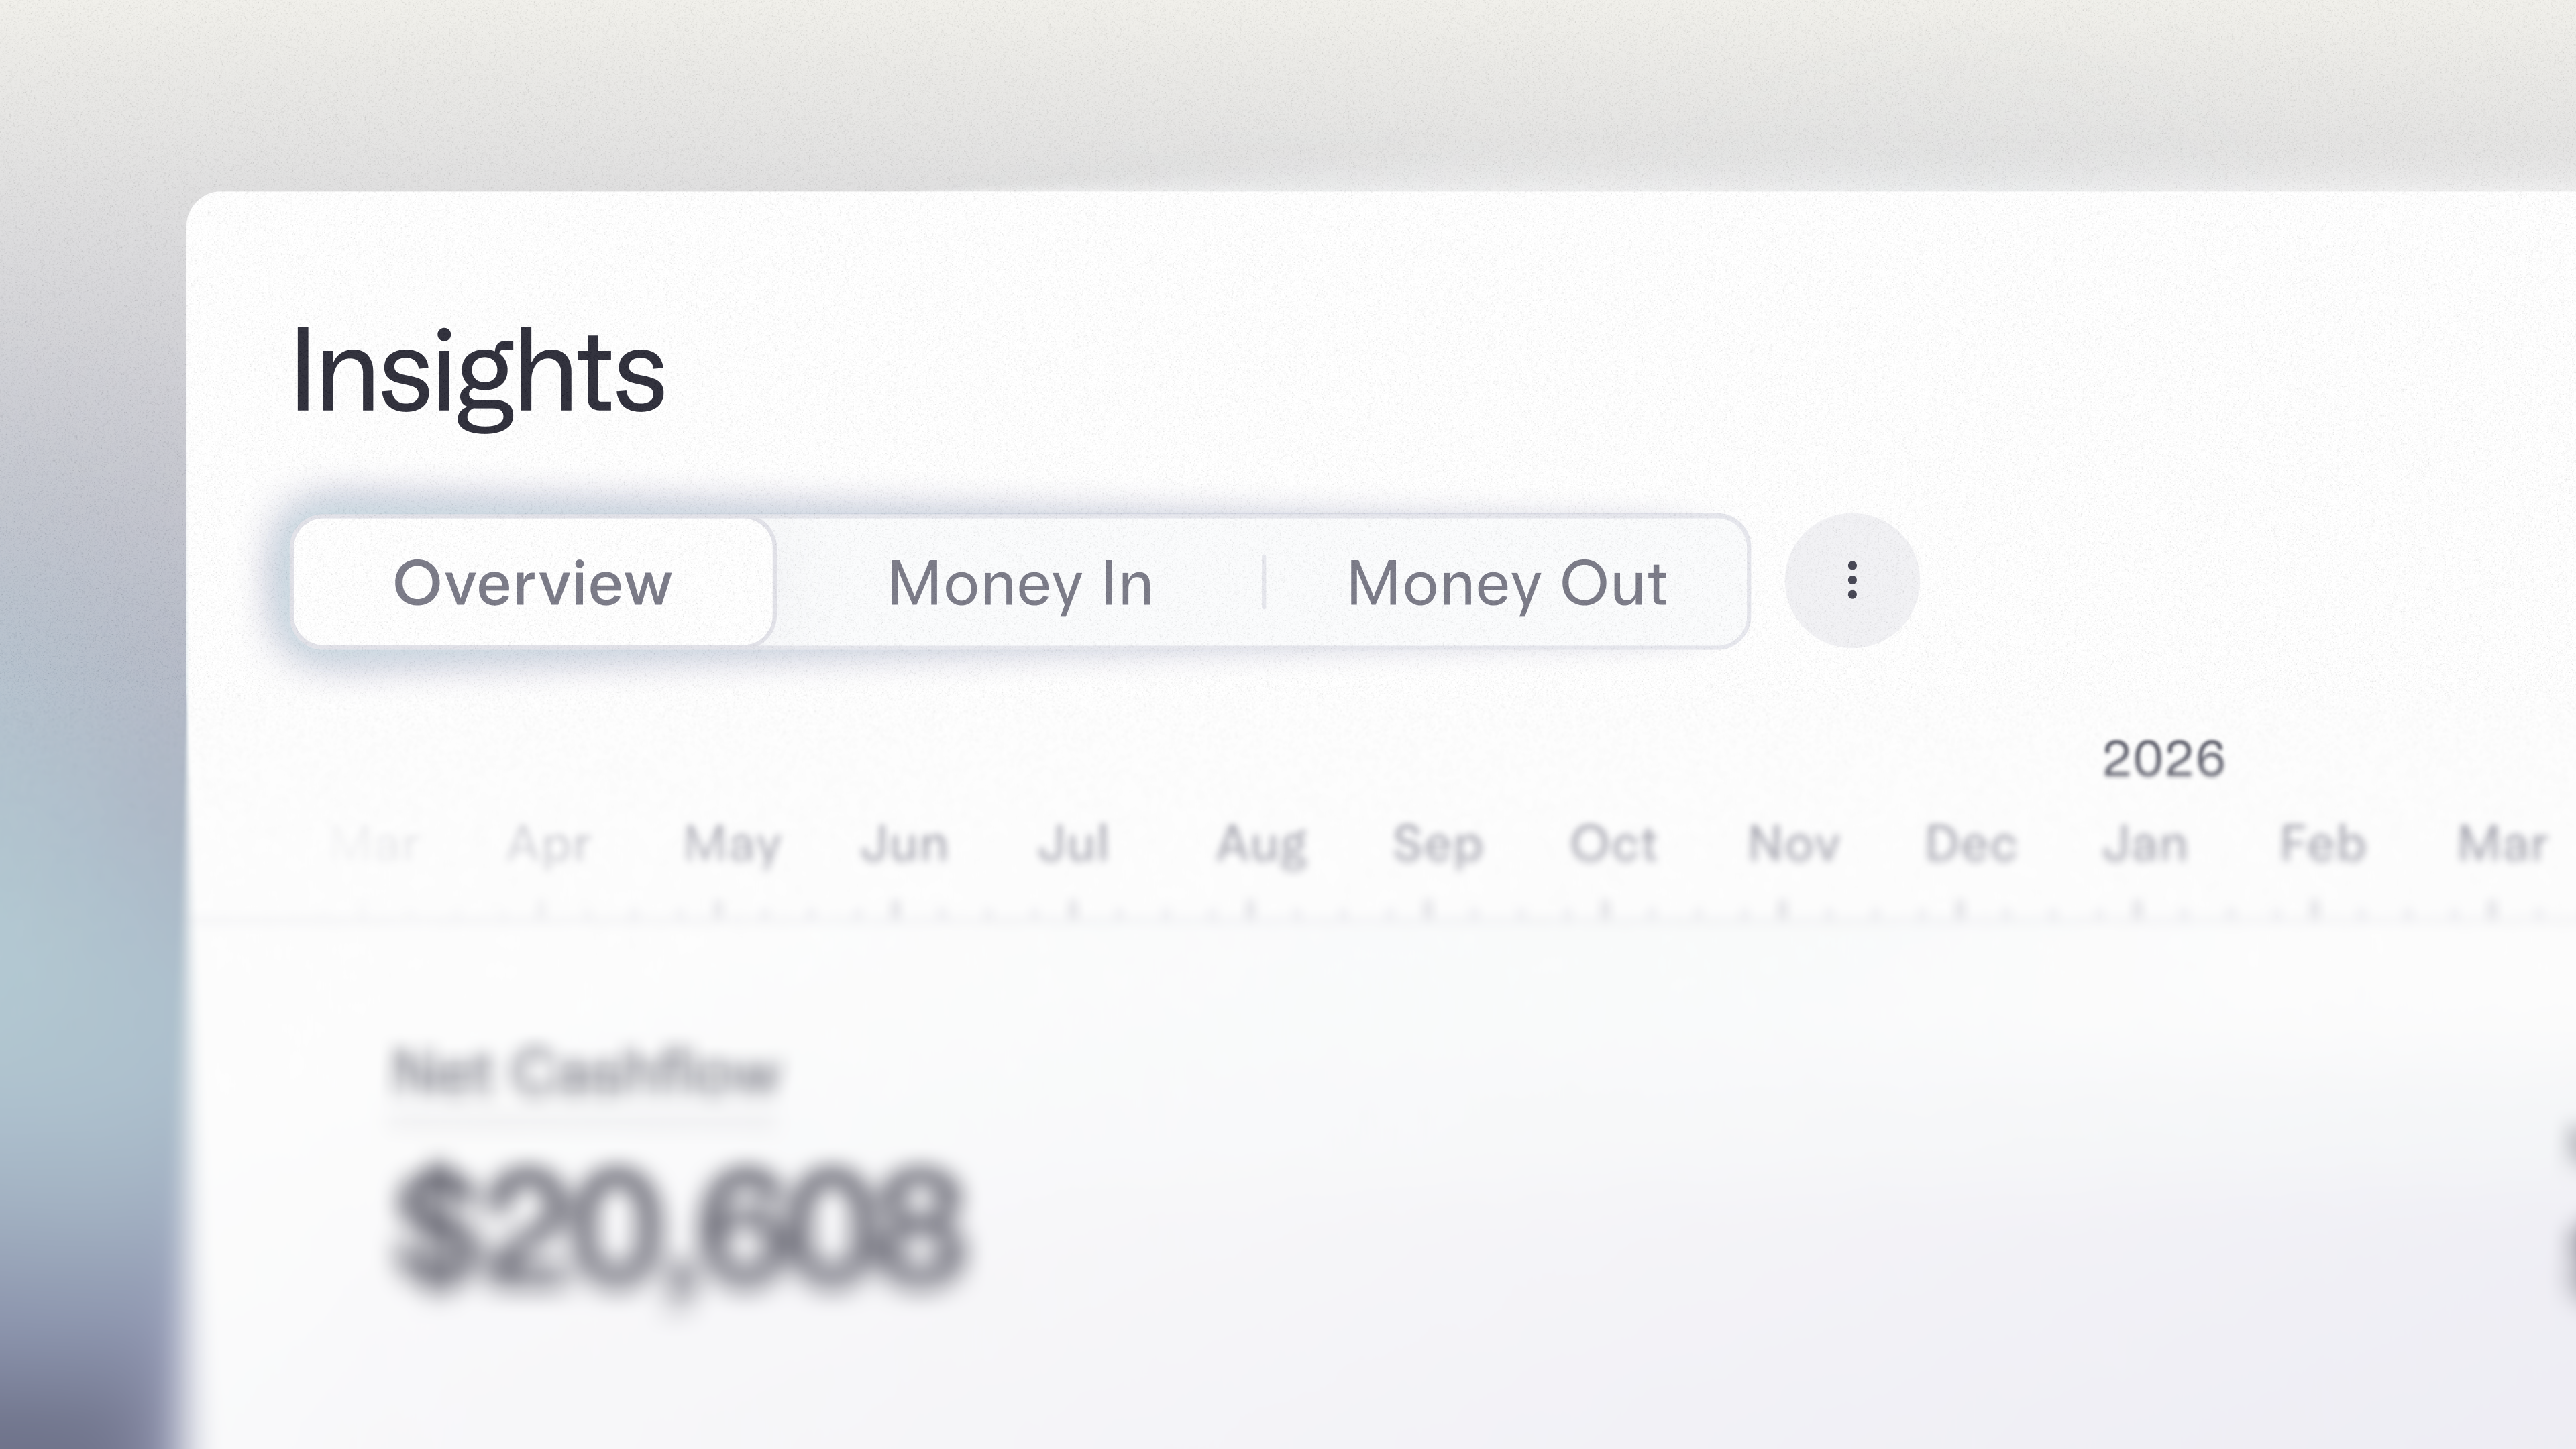
See your cashflow at a glance
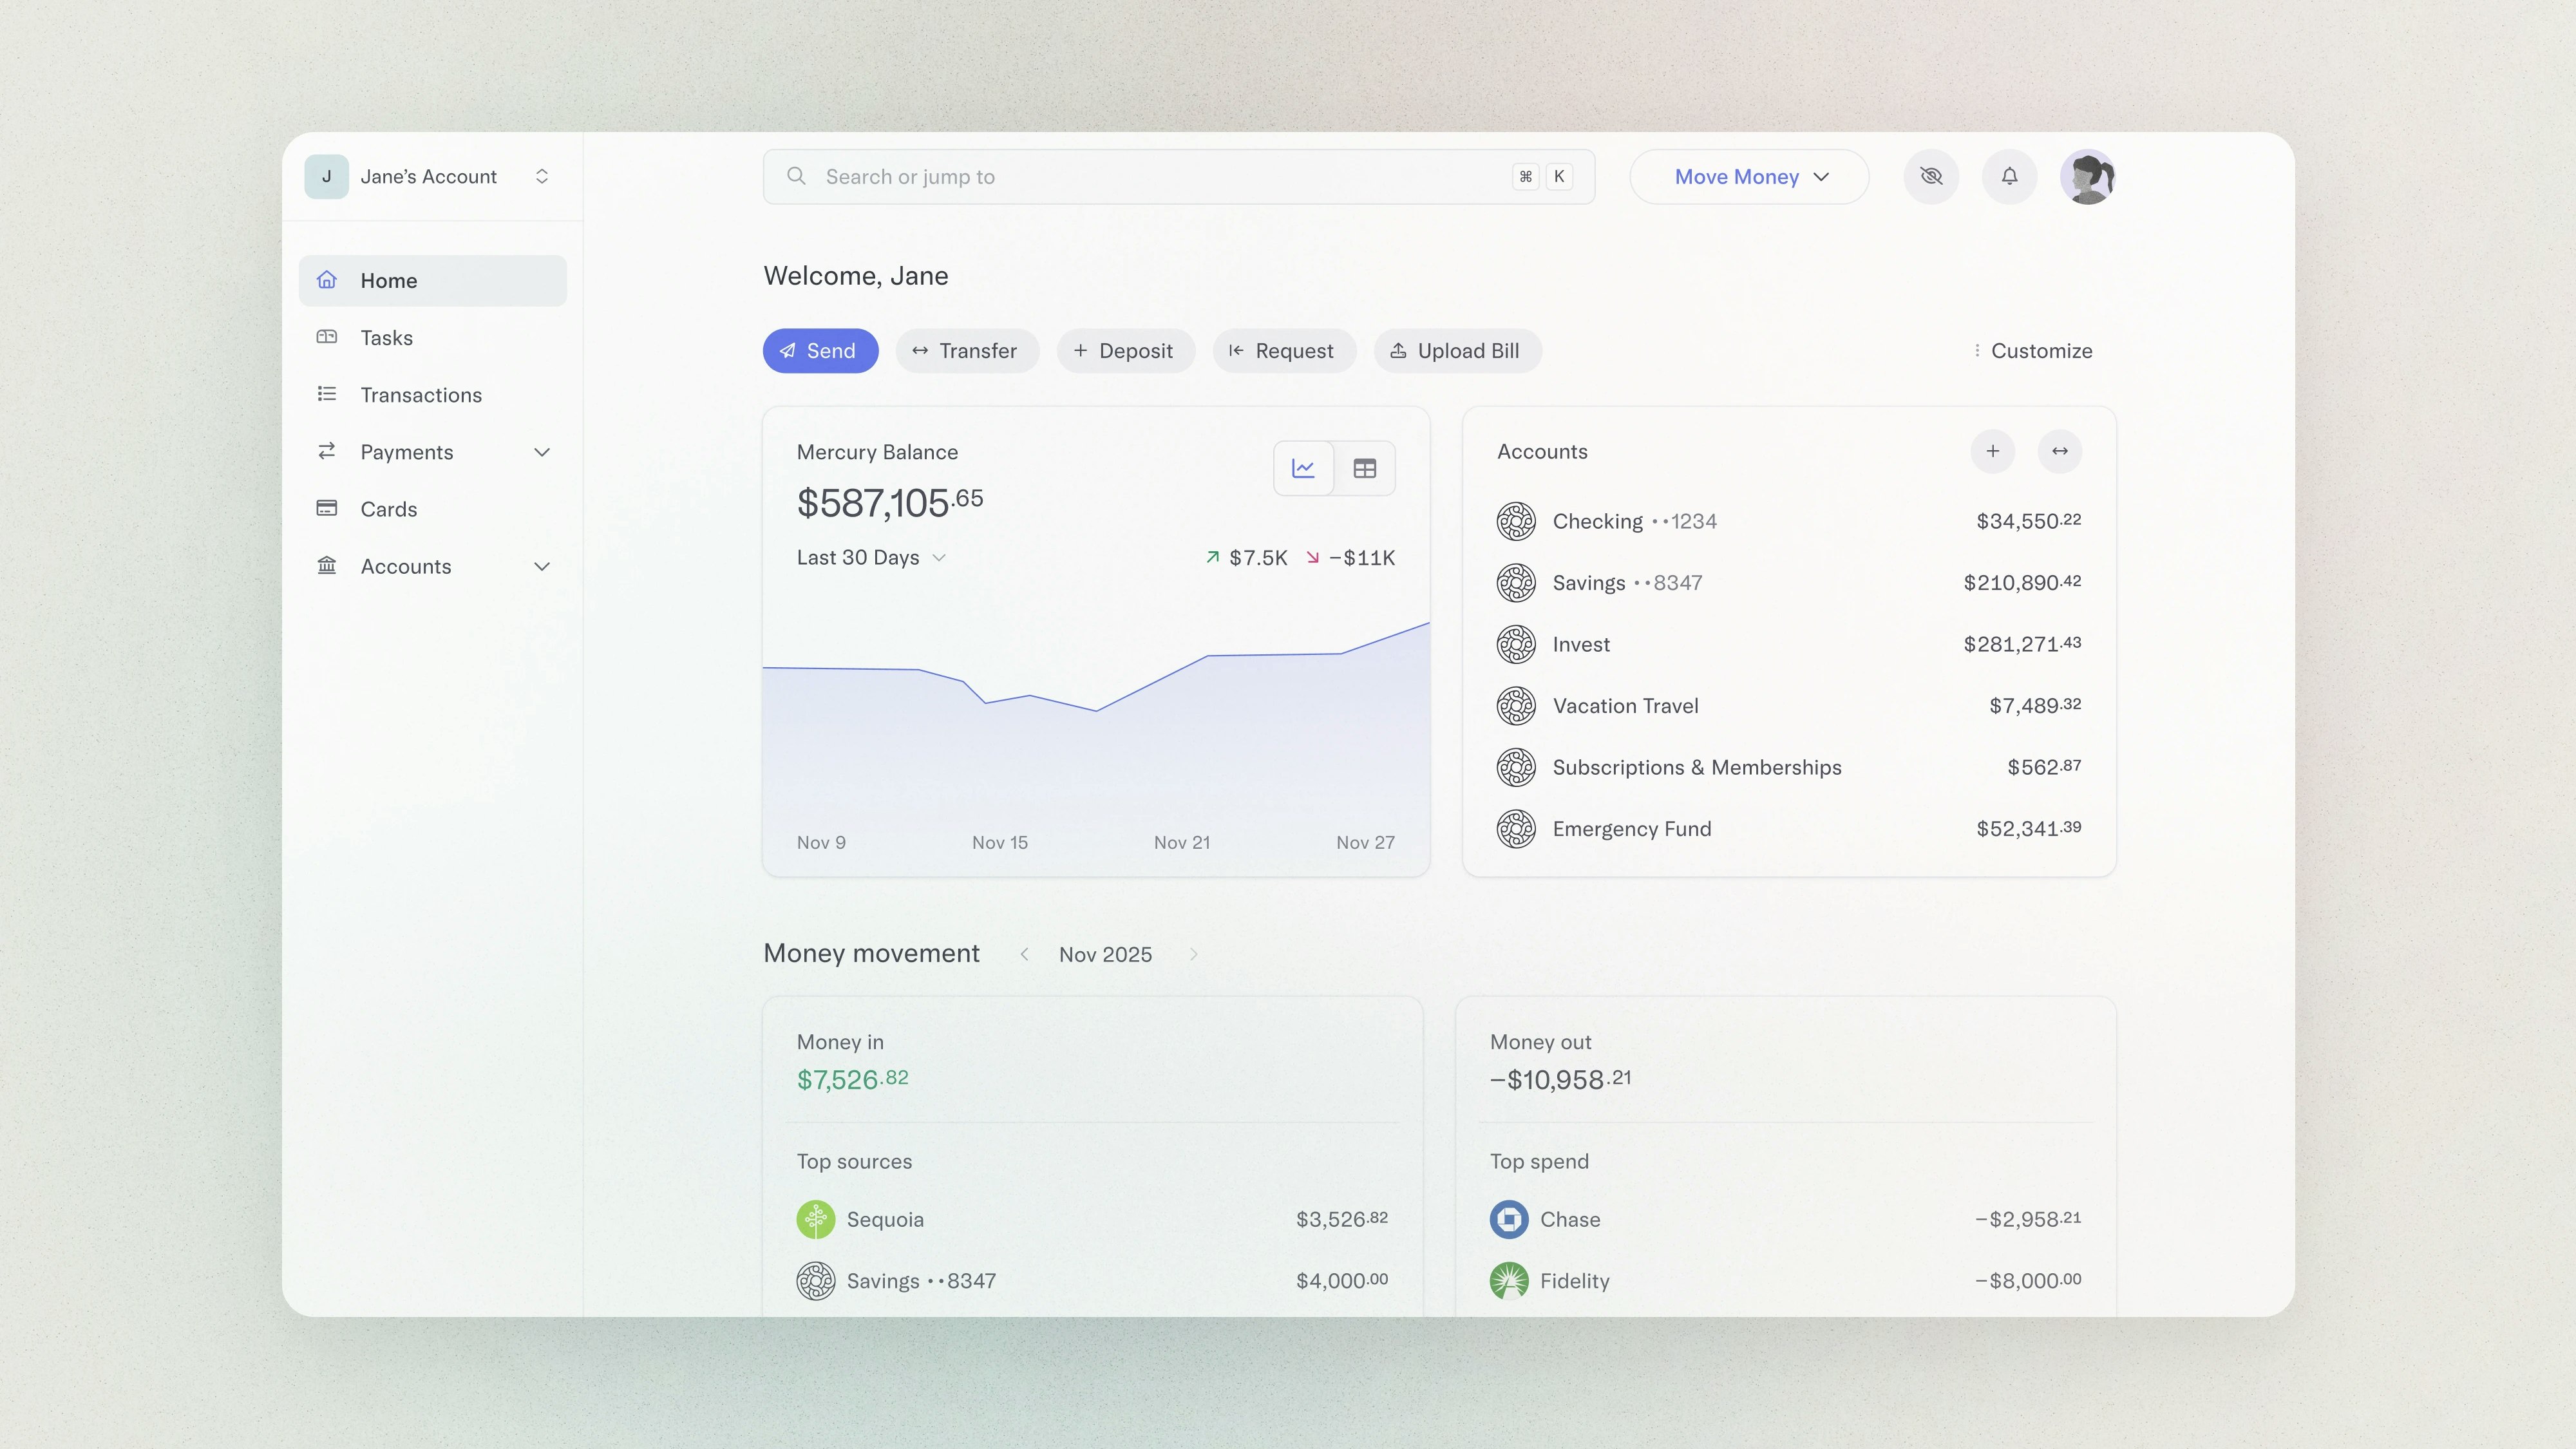
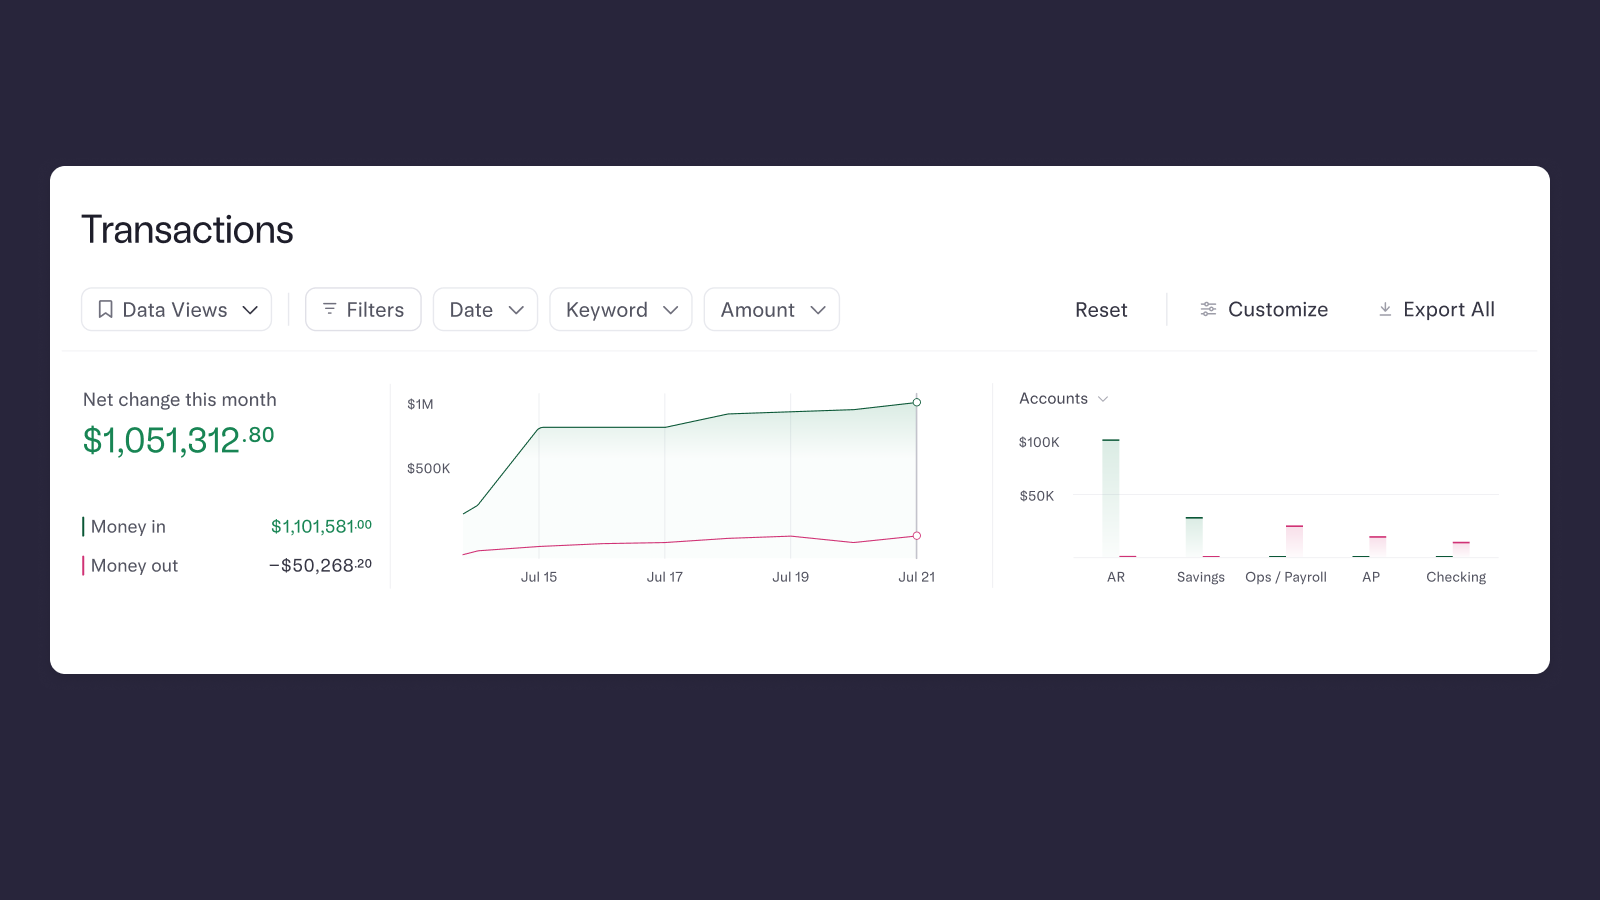
Right when you land on your Transactions page, you’ll see two real-time charts designed to help you understand how your money is moving:
- Cashflow graph: Set to the current month by default, this chart shows all the money moving in and out of your account — with the option to zoom into specific days or adjust to any custom timeframe.
- Money movement breakdown: This chart shows your top five sources of cash inflows and outflows grouped by account, card, category, merchant type and more — so you can see where money is coming from and where it’s going.
Your cashflow graph automatically updates based on any filters you apply to the transactions table below it, so the chart always reflects the corresponding slice of data.
Pro tip: Filter Date to show transactions for Last Month for an instant look at your last month’s burn rate.
Treat your transactions like a spreadsheet — without leaving your bank
Need to dig into expenses by category or account? Your transactions table is now fully interactive — with spreadsheet-style capabilities — built right into your account. No CSV exports or third-party dashboards needed.
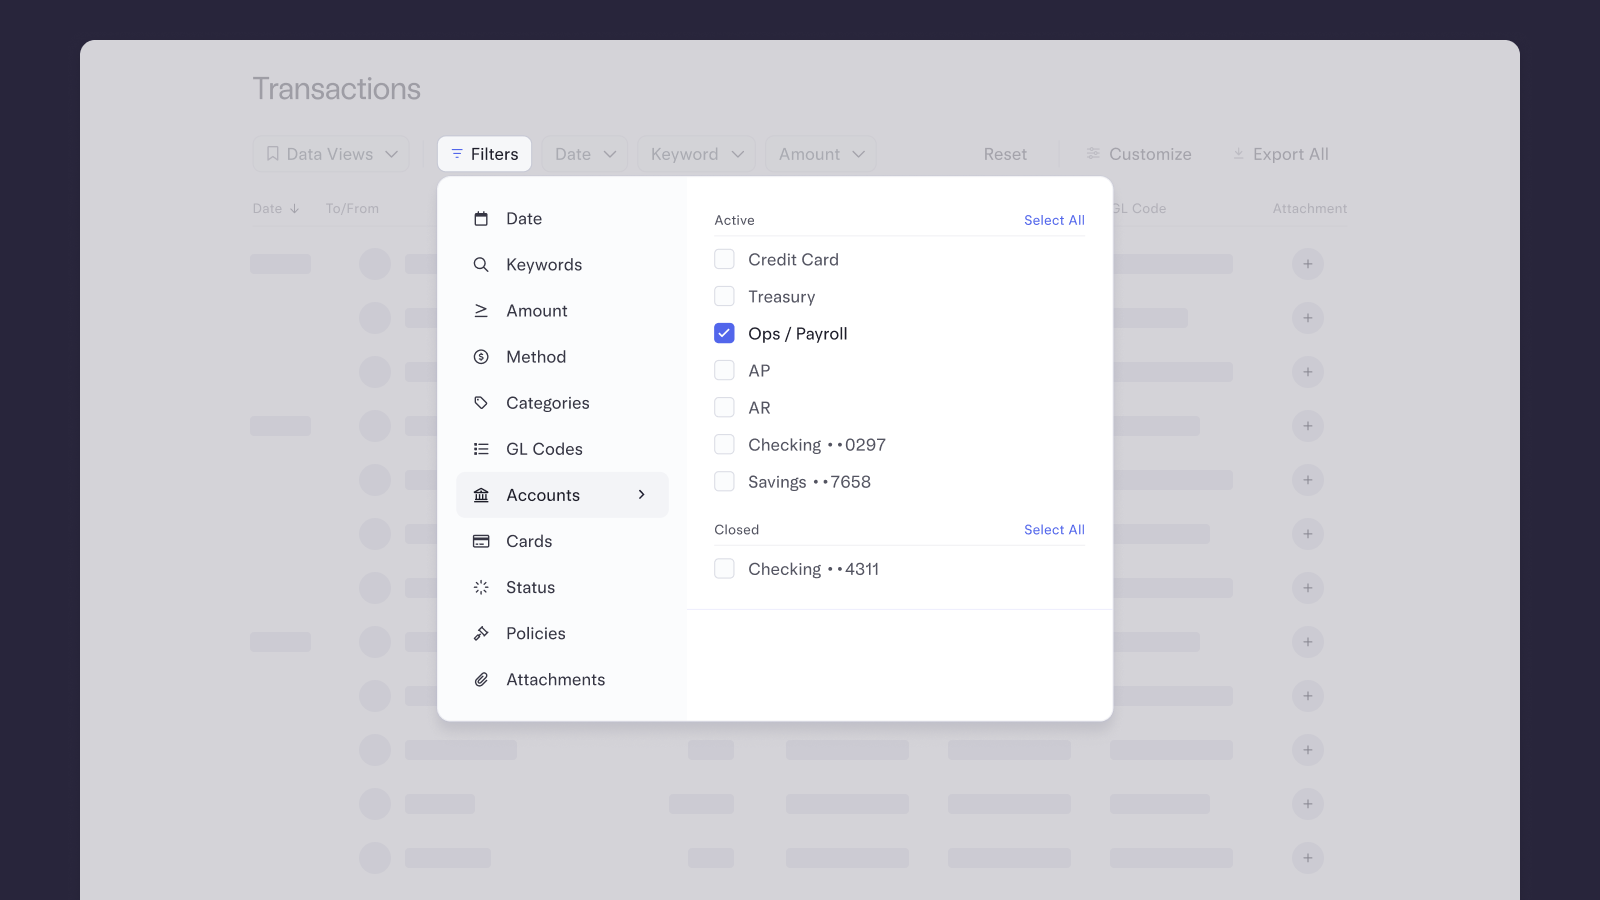
- Filter by date, keyword, or amount in one click — or drill down to use advanced filters like category, merchant type, team member, GL code, and more
Pro tip: Filter for Account = Ops/Payroll to see how your opex is trending this month.
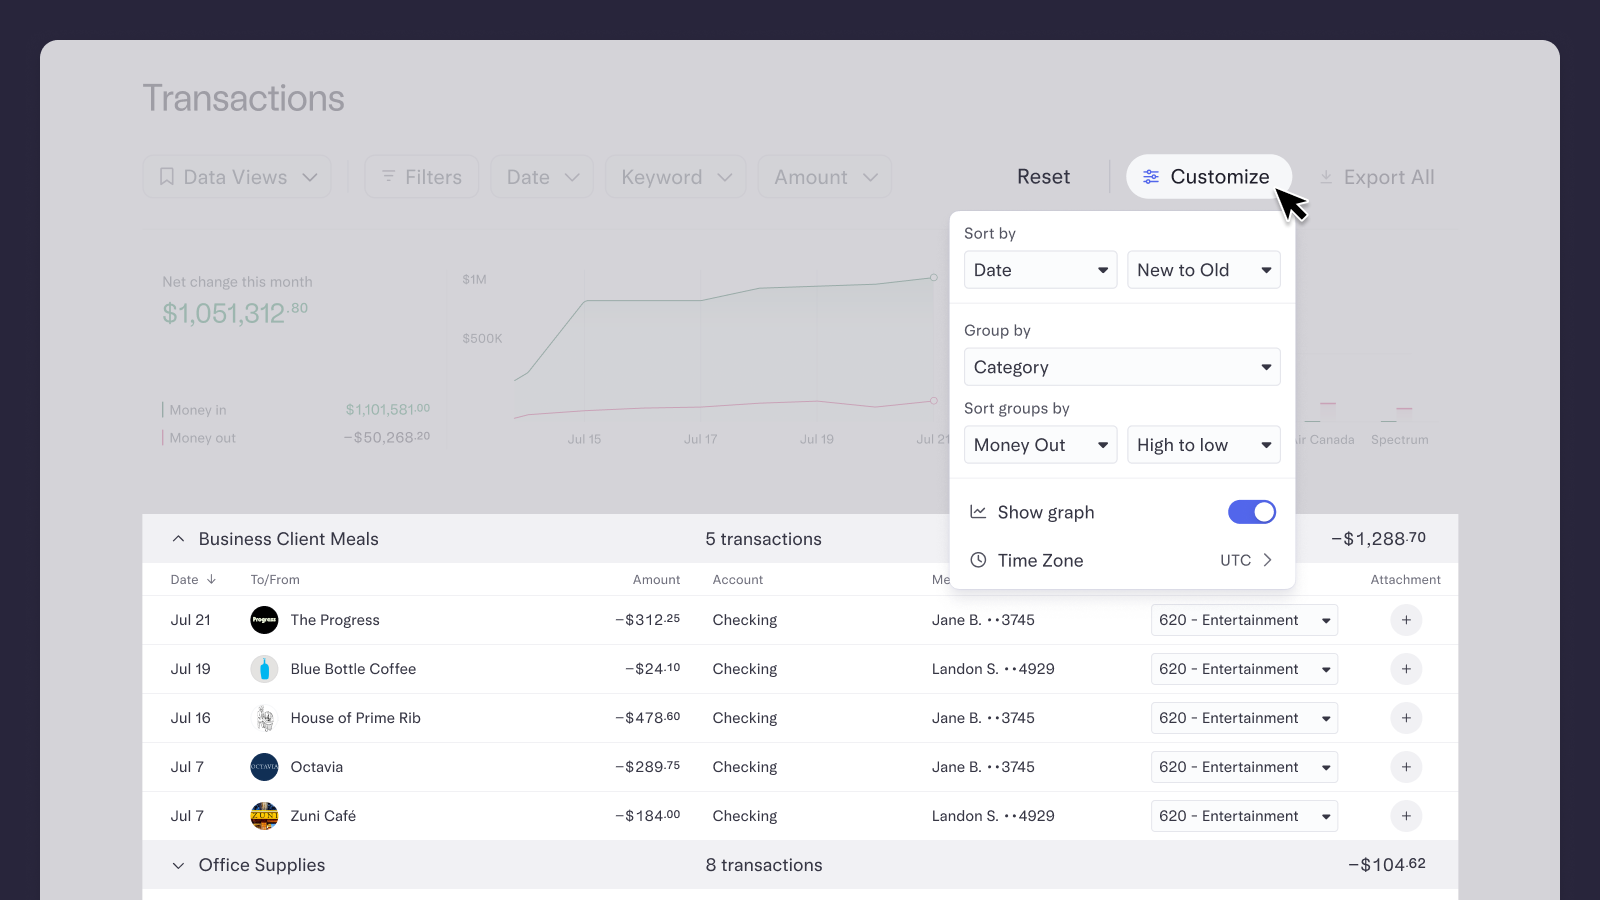
- Sort or group your transactions, under the Customize menu, for a more detailed view of specific segments of spend
Pro tip: Group by Category and Sort groups by Money Out to see your top-spending categories ranked.
Save what’s important as a Data View
You probably have a few go-to ways of reviewing your spend. With Data Views, you can save your favorite filters — like monthly burn, category-specific costs, or tax-year summaries — so you don’t have to reinvent the wheel every time.
- Save commonly-used filters (or even combinations of filters) as Data Views for one-click access anytime
- We’ve set up a few Data Views for you by default: My transactions, Monthly money in, and Monthly money out
Pro tip: Filter for Date = Last Month and Category = Software and save it as a Data View called Monthly Software Spend.

Clean up quickly with bulk editing
When your data needs cleanup, we’ve made it faster and easier — so your month-end close feels a little less hectic. Now, you can:
- Select and bulk-edit categories and GL codes across multiple transactions at once
- Sync clean data to QuickBooks, Xero, or NetSuite — or store it in Mercury if you’re not using an ERP
Pro tip: Bulk-edit the Category to Travel for your Uber rides and restaurant meals from your last work trip.

Start exploring
Ready to see all of this in action? Head to your Transactions page or give these new tools a spin in our Demo. You can also learn more in our Help Center.
About the author
Evan is a Product Manager at Mercury, where he leads a team building the web product.
Share article
Related reads