Report: The new economics of starting up

In an economic climate defined by uncertainty, many early-stage founders are still charging forward. To understand how startup and business leaders are navigating the shifting tides of capital, technology, and operational costs, we surveyed 1,500 U.S.-based entrepreneurs running companies under 6 years old. What emerged is a portrait of resilience: Founders are optimistic, increasingly AI-forward, and embracing flexible, diversified approaches to funding and hiring. Here, we’ll explore the key trends shaping how companies start up today — from capitalization strategies to tech spending, contractor use, and beyond.
Methodology: Data is based on a Mercury-commissioned survey of 1,500 U.S.-based early-stage company founders and executives in May 2025 to understand how economic conditions, tech adoption, and other factors are reshaping startup finances and strategies. Data points are rounded up or down to the nearest single digit, which means some things won’t add up to 100%.
How are founders feeling?
On confidence, sentiment, and the big and small pictures
Before we get into dollars and cents, let’s talk about the elephant in the room. With economic tumult and anxiety seemingly through the roof, how are entrepreneurs actually feeling about their own business’s financial prospects? In an economy that has many people tightening belts, those building early-stage companies are feeling... surprisingly good.
Concerns about inflation were real (36% said it had negatively impacted their business), but were slightly outweighed by businesses positively impacted (38%); 25% of respondents indicated they weren’t meaningfully impacted. That said, these entrepreneurs weren’t without worry — they had at least some concern about the impact of the following on their business or industries:
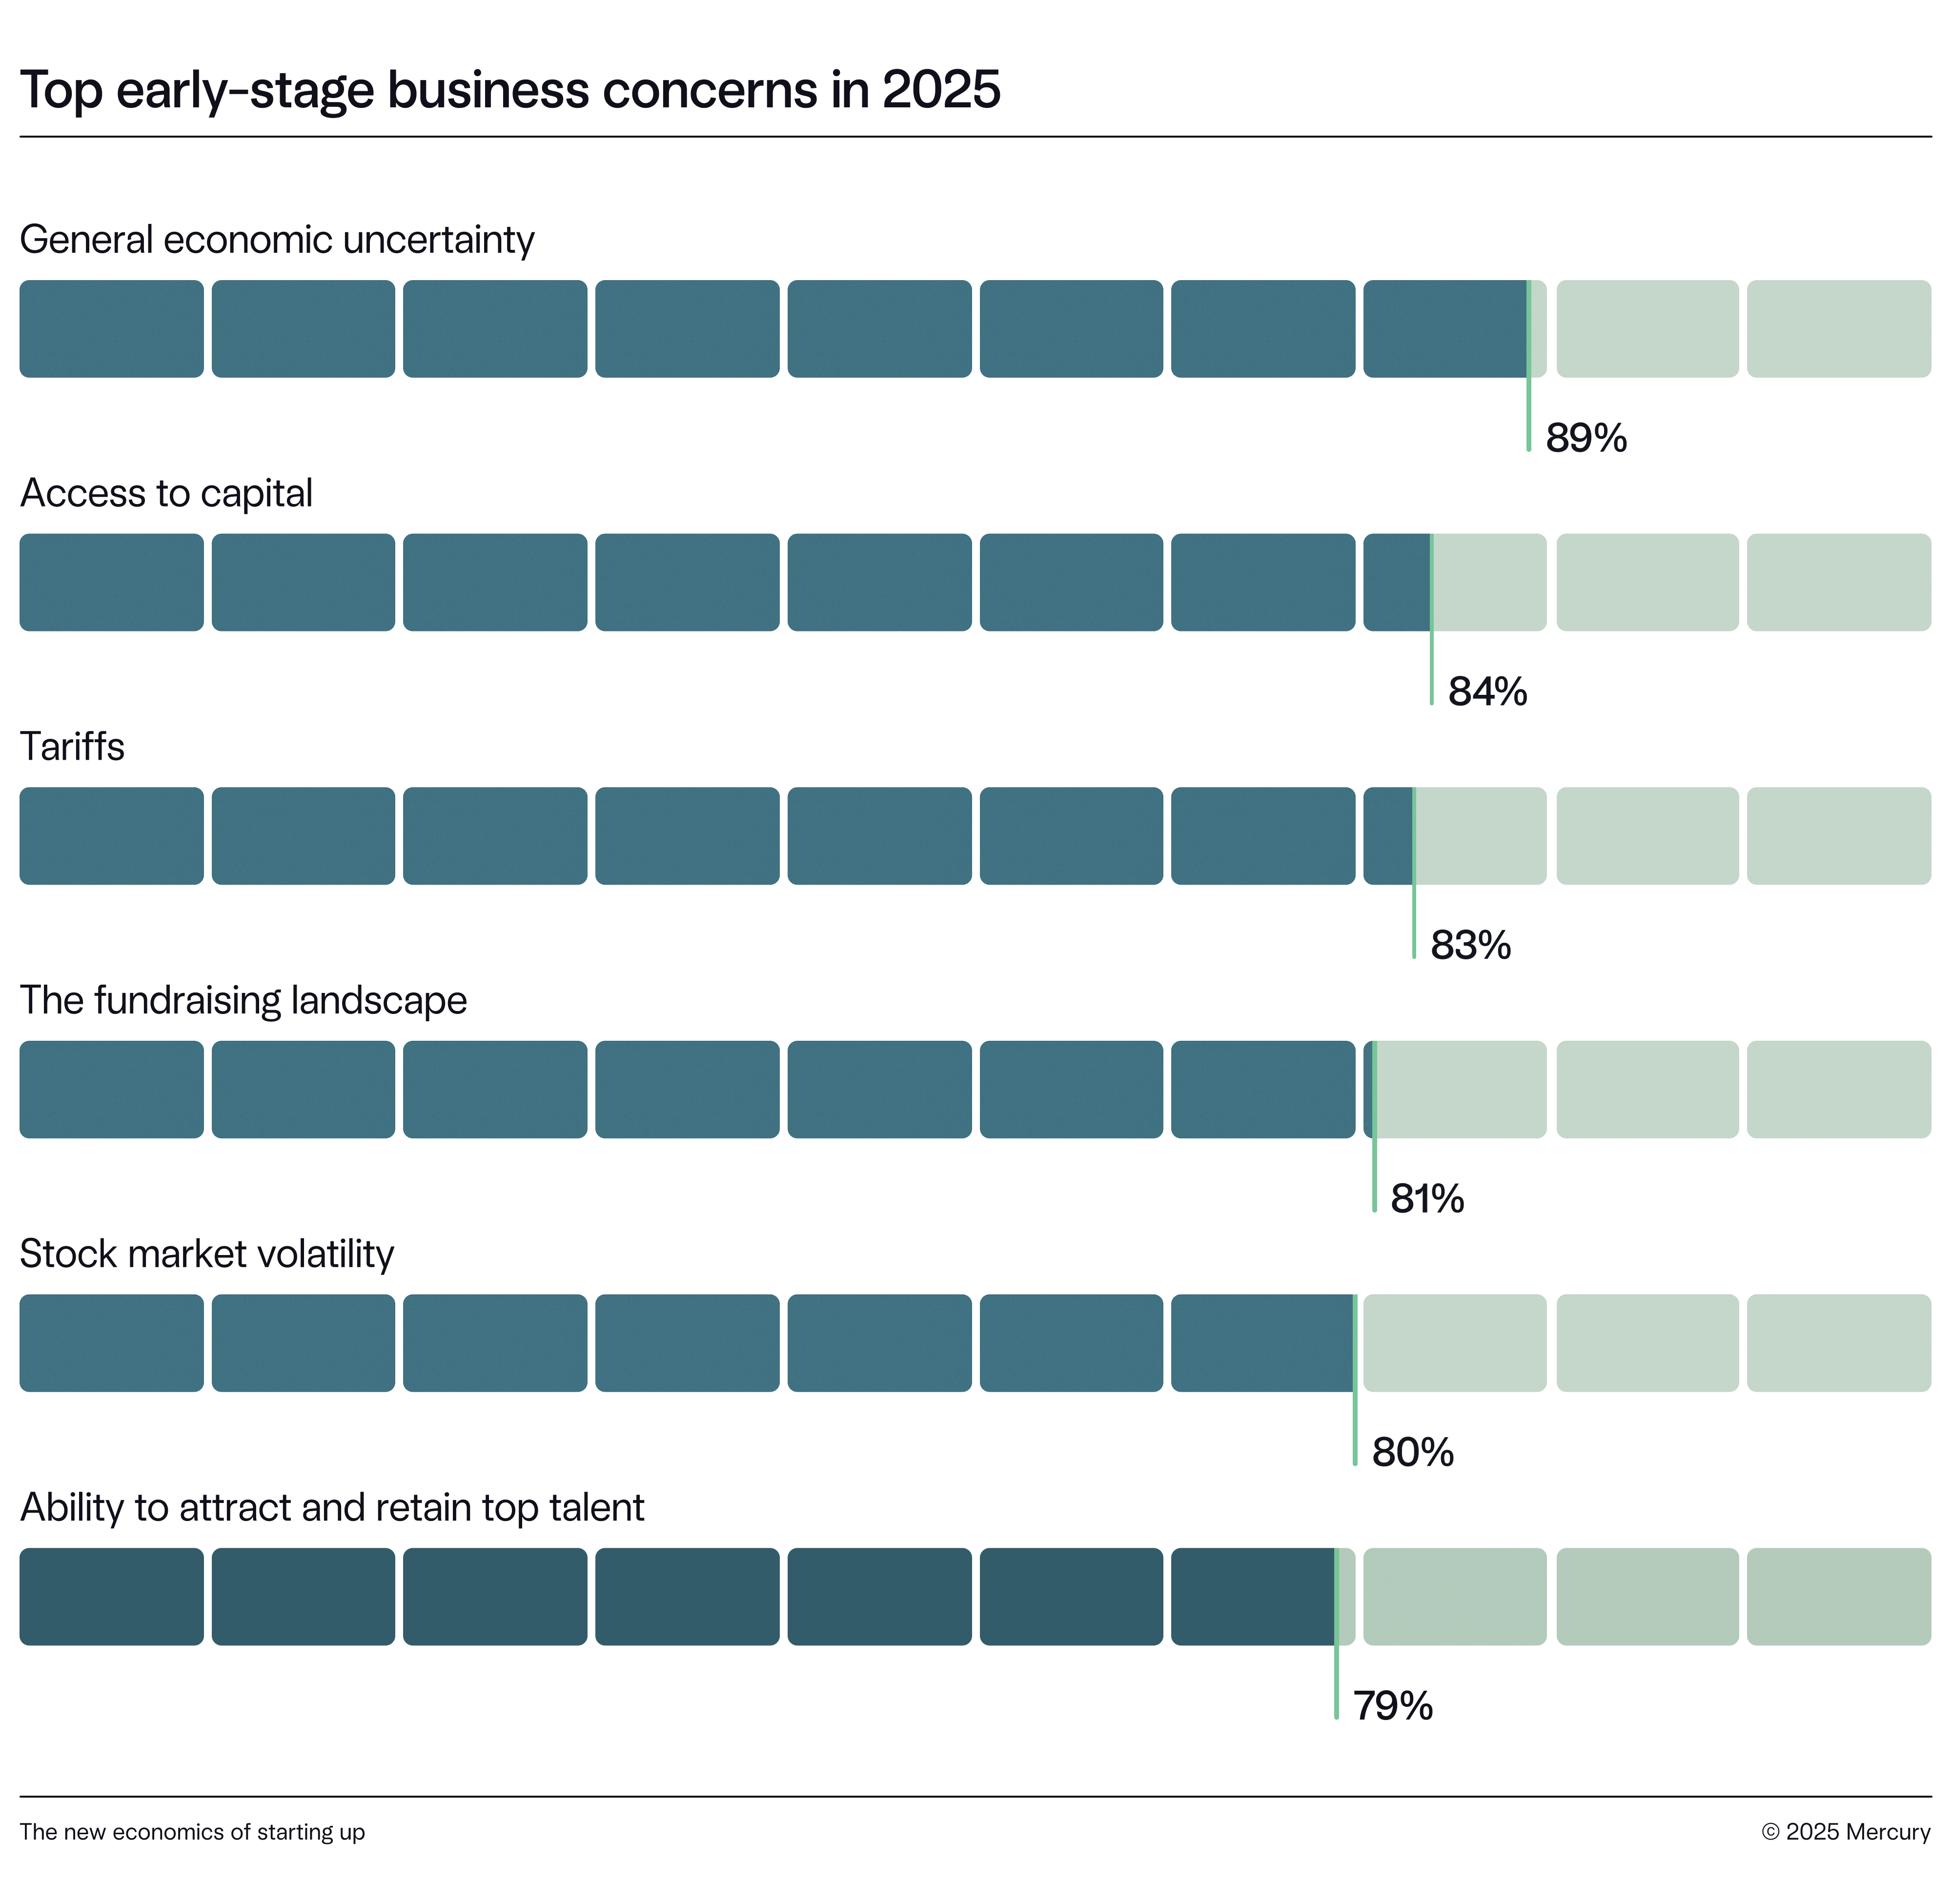
But few seemed overwhelmed by their macro worries. In fact, 87% of entrepreneurs reported their confidence in their business’s financial prospects had improved compared to 2024. Only 3% said it declined.
Founders at companies with higher annual revenue ($10M or more) were most likely to report significant improvement in year-over-year confidence (50%, compared to 38–39% for companies with lower annual revenue) — though, we suppose, that could be because they’re already bringing in good money.
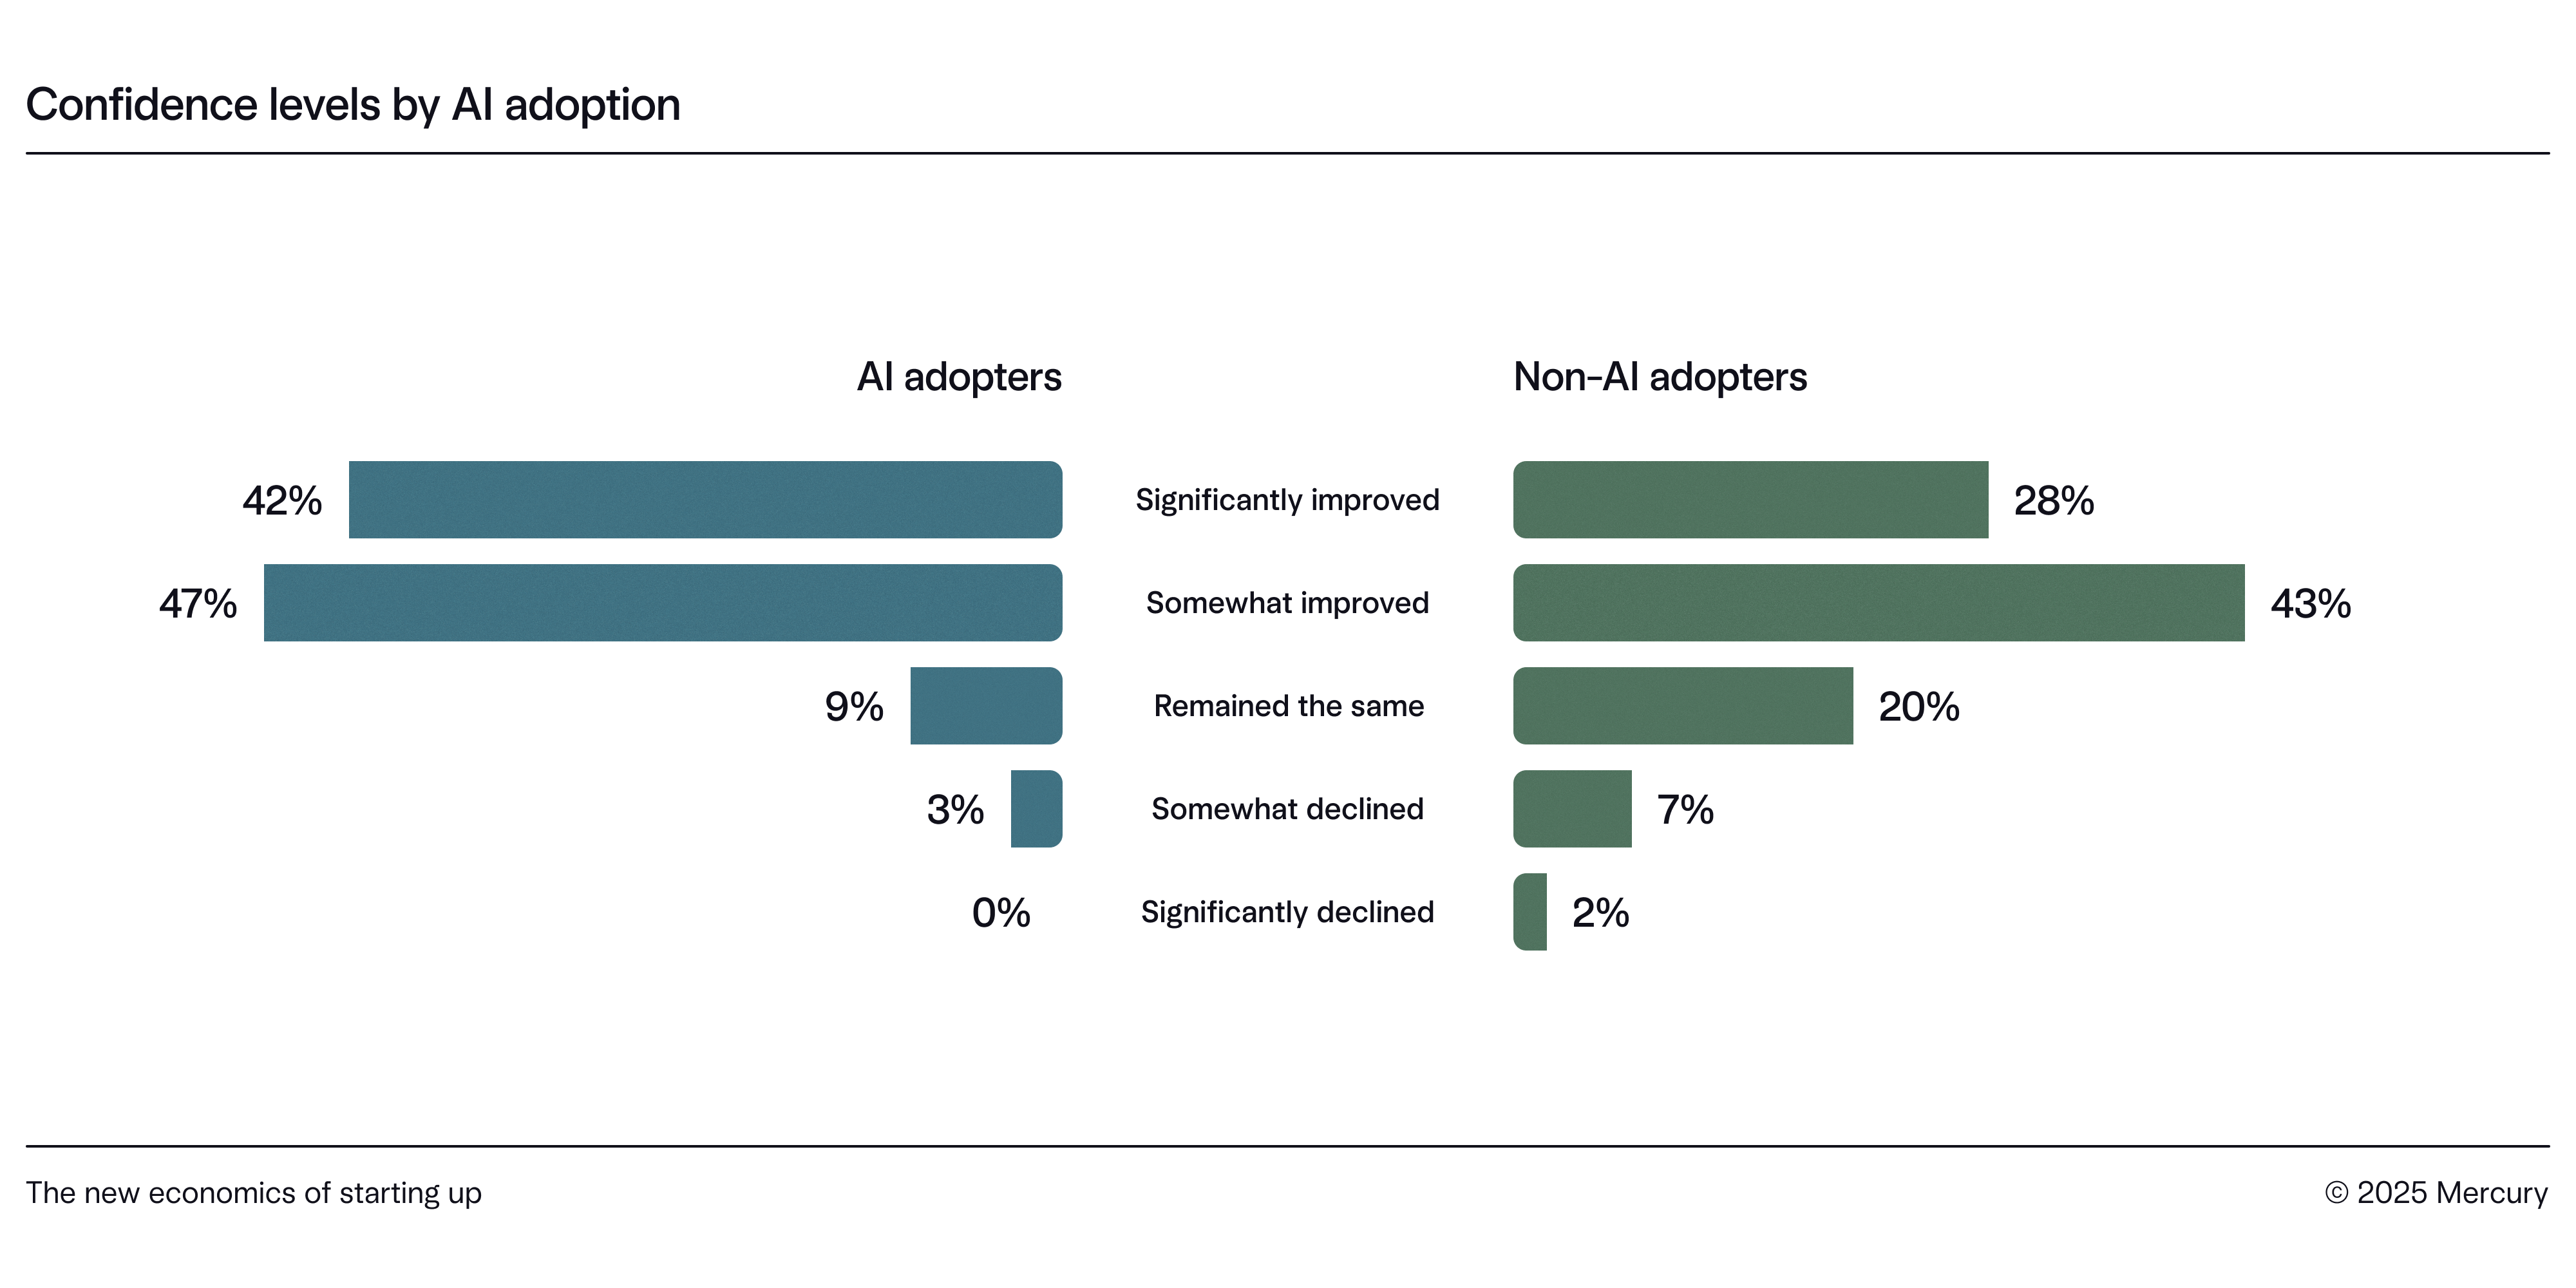
We also spotted a meaningful split between companies that reported significant use of AI and those that didn’t. Those whose businesses have significantly adopted AI noted dramatically higher optimism, regardless of industry: 60% said their confidence in financial prospects had “significantly improved” compared to 2024, versus just 28% of companies that haven’t adopted AI tools. (The average across AI adopters overall — including those who had only some adoption of the tech — was a still noteworthy 42%.) Companies that have invested significantly in AI adoption had a 93% positive outlook overall, versus 71% for non-AI adopters. Which came first: the AI or the optimism?
Slicing by industry, founders in financial services were most likely (49%) to note significant year-over-year improvements in confidence in their financial prospects, while professional services were least likely (32%).
The experience chasm
All survey respondents were building early-stage companies (formed within the last six years), but those who had been involved in founding one or more companies before seemed more tempered across the board.
88%
of first-time founders reported increased business optimism year over year — vs. 76% of repeat founders.
Regardless of revenue or AI use, first-time founders were more likely than repeat founders (88% vs. 76%) to report improved optimism. Perhaps this suggests that first-time founders — even if they’ve been at early-stage companies before — may lack certain battle scars that make repeat founders more measured in their outlook. And this may be true even if, as our data shows, they’re in similar industries, of similar ages, and/or earning similar revenue.
A look at some noteworthy gulfs:
Repeat founders | First-time entrepreneurs | |
|---|---|---|
On confidence | 36% somewhat or significantly improved confidence YoY, vs… 11% somewhat or significantly declining confidence year over year, vs… | 41% 2% |
On AI adoption | 29% have significantly incorporated AI tools into their business, vs… Wondering if it’s a “years of service” generational gap? Not so much. 91% of Gen Z and Millennial entrepreneurs had incorporated at least *some* AI into their businesses — compared to a close 87% of Gen X and Baby Boomer entrepreneurs. | 45% |
On hiring | 21% likely to be actively scaling current team size, vs… | 33% |
Now that we know where the feelings are, let’s talk money.
Where’s the money coming from?
On funding businesses and making money
Capital strategies
Entrepreneurs surveyed showed a preference for diversified funding strategies that combine multiple capital sources — which, at least in some industries, like tech, runs a bit counter to past cycles of single-track funding. (This is echoed in recent analysis by Eqvista: “There is substantial diversification in the startup capital environment. Currently, startups are searching for funding options other than traditional venture capital, increasing government grants, debt financing, and crowdfunding.”) These days, the end-all, be-all — even in tech — is not necessarily VC money.
A funding leaderboard, as it were:
Industry | |
|---|---|
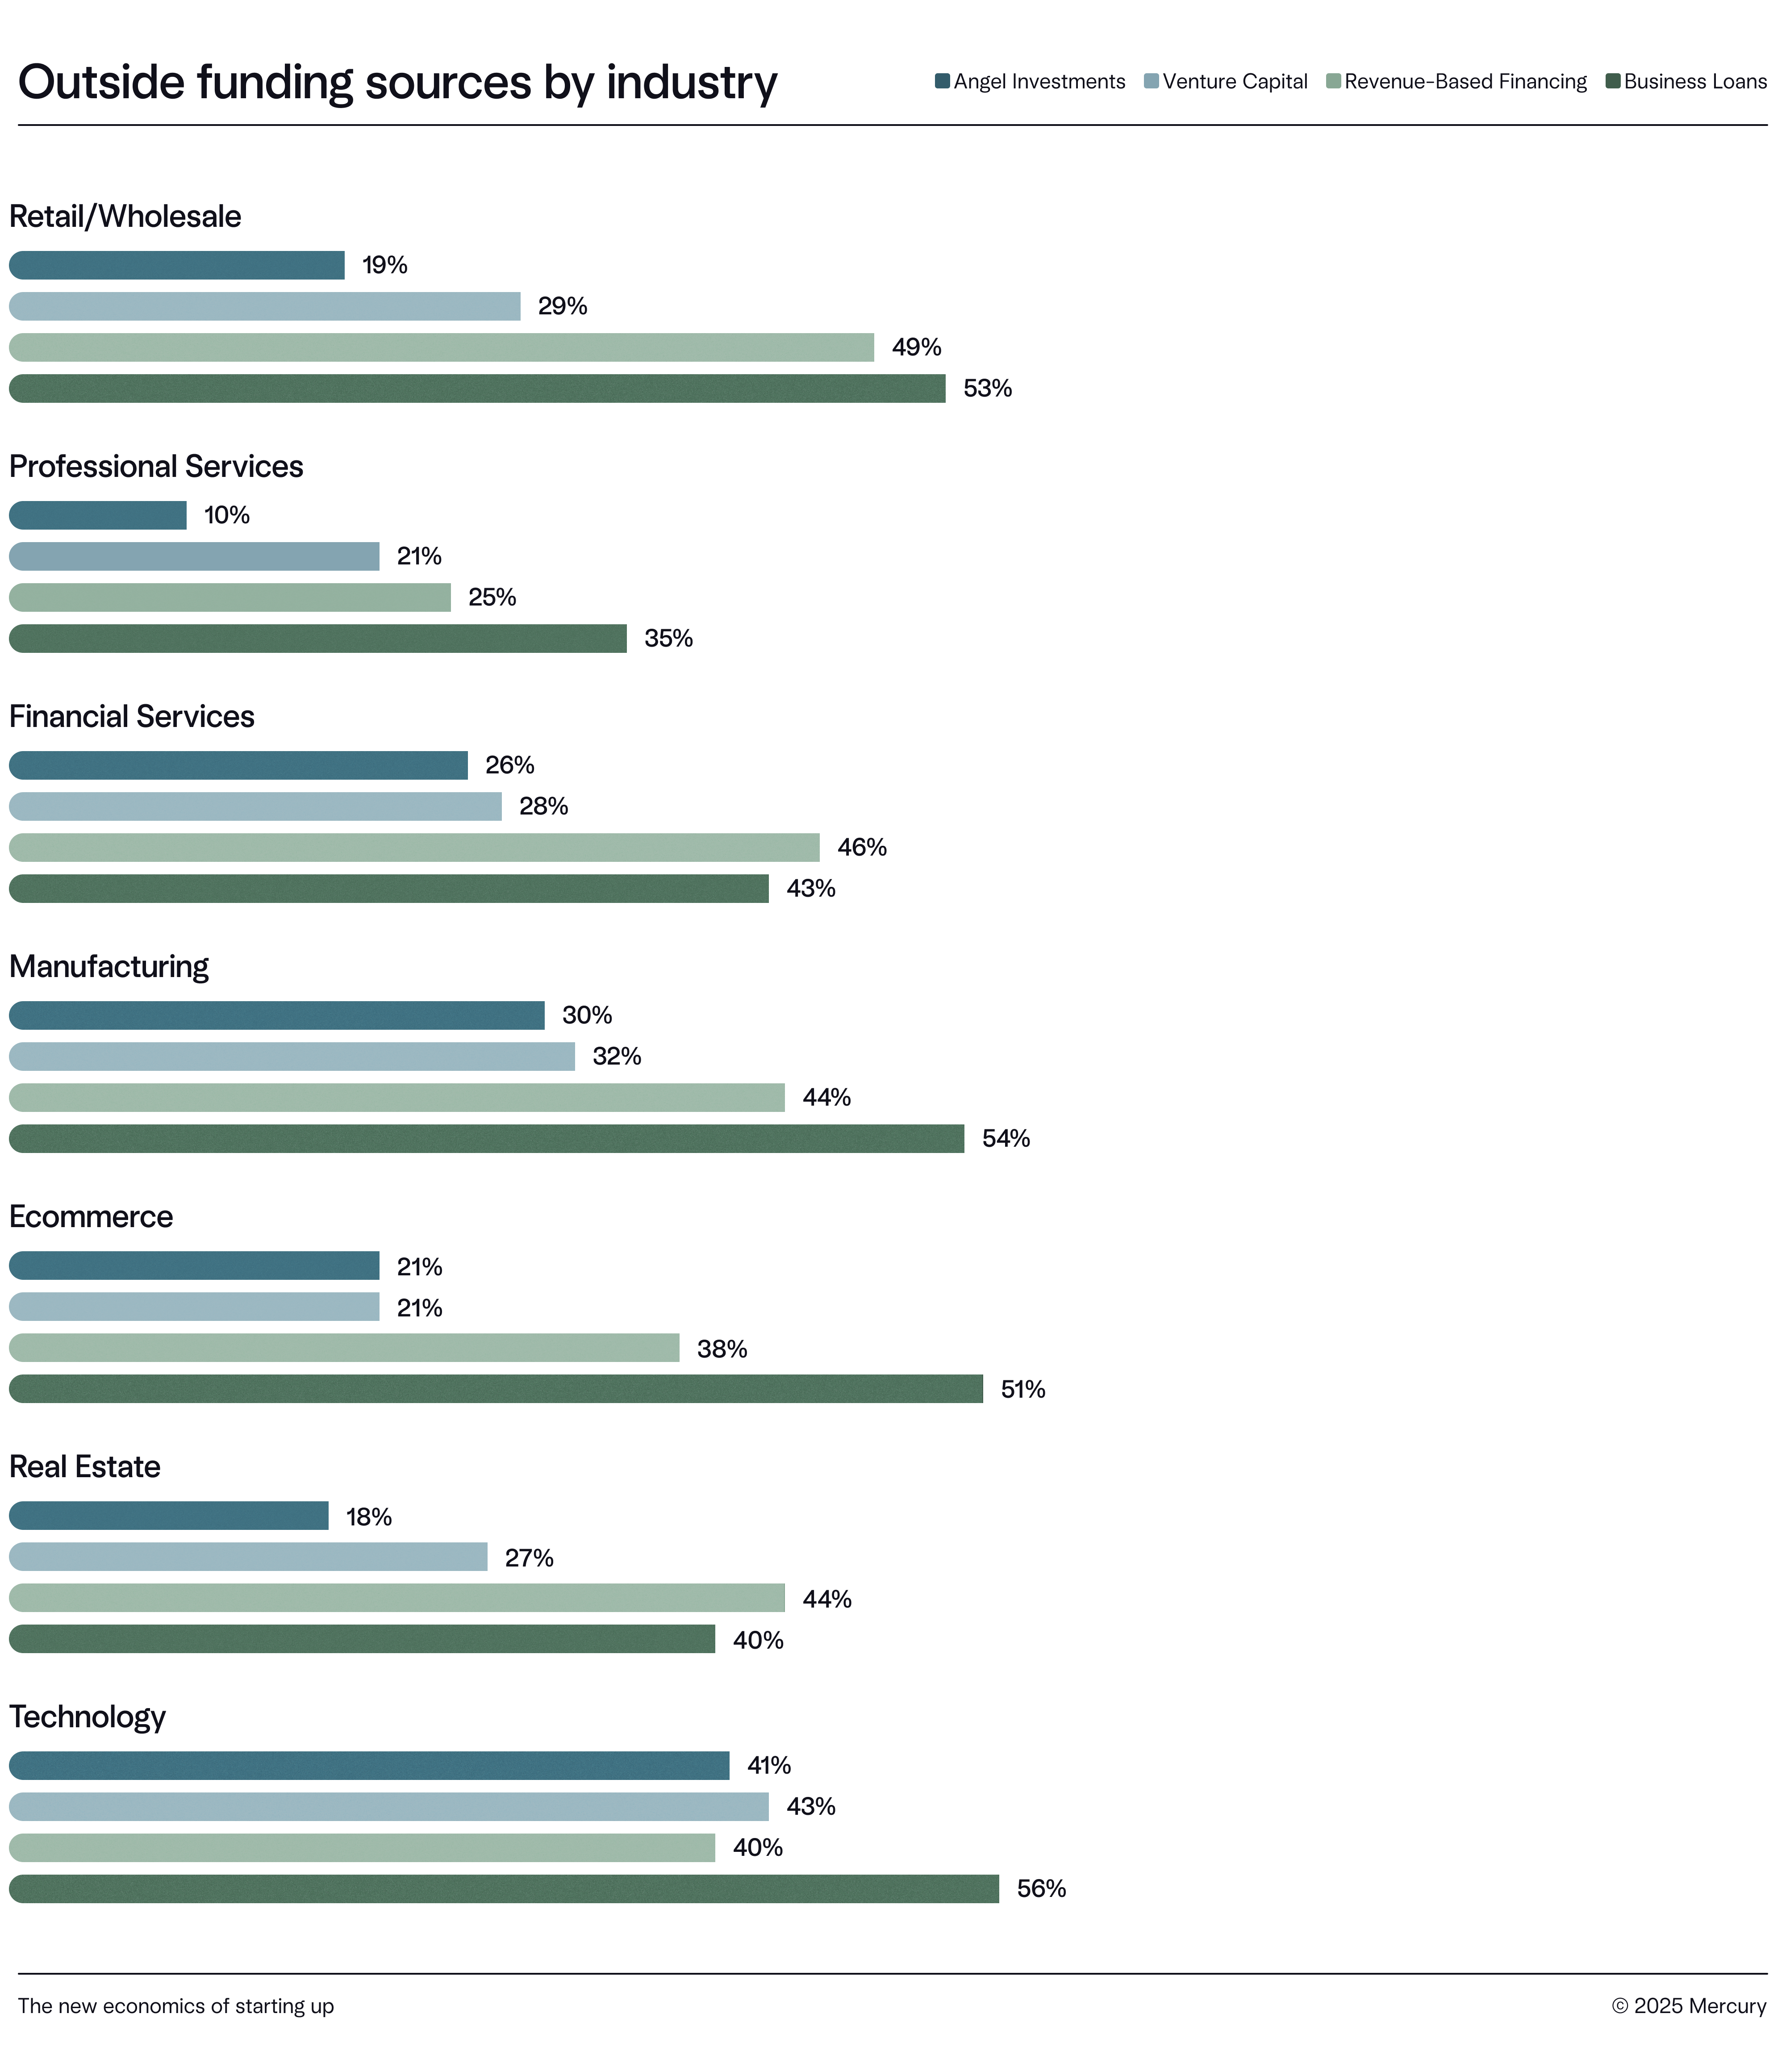
Most likely to self-fund | Professional services (72%) |
Most likely to take angel investments | Tech (41%) |
Most likely to take revenue-based financing | Retail/wholesale (49%) |
Most likely to take loans | Tech (56%) |
Drilling down further, some highlights:
- Besides self-funding, professional service businesses — such as agencies and consultancies — were on the low end across funding categories. That makes sense: Many are LLCs, and 27% surveyed had teams under 10 people. Still, with 21% raising venture capital and 10% receiving angel investment, they’re more tapped into the investment landscape than some might think.
- At the other end, tech companies were near the top across most funding sources — except revenue-based financing, where they landed mid-pack. While equity plays heavily in Silicon Valley funding narratives, more than half of early-stage tech companies surveyed hadn’t yet raised VC money.
Now, speaking of venture capital…
How much are businesses raising?
Round sizes for these early-stage companies generally skewed small: 73% raised under $5M in their last round. (This generally tracks with median seed round sizes of ~$2.5M, according to Carta.)
- 22% raised under $1M in their last round
- 51% raised between $1–5M
Still, some of these early-stage companies were raising big numbers: 27% raised more than $5M in their last fundraising round. Tech companies were most likely to have raised over $20M in their last round — 10% vs. just 3–4% across other industries.
And in general, once funding rounds broke $5M, they tended to scale with company size.
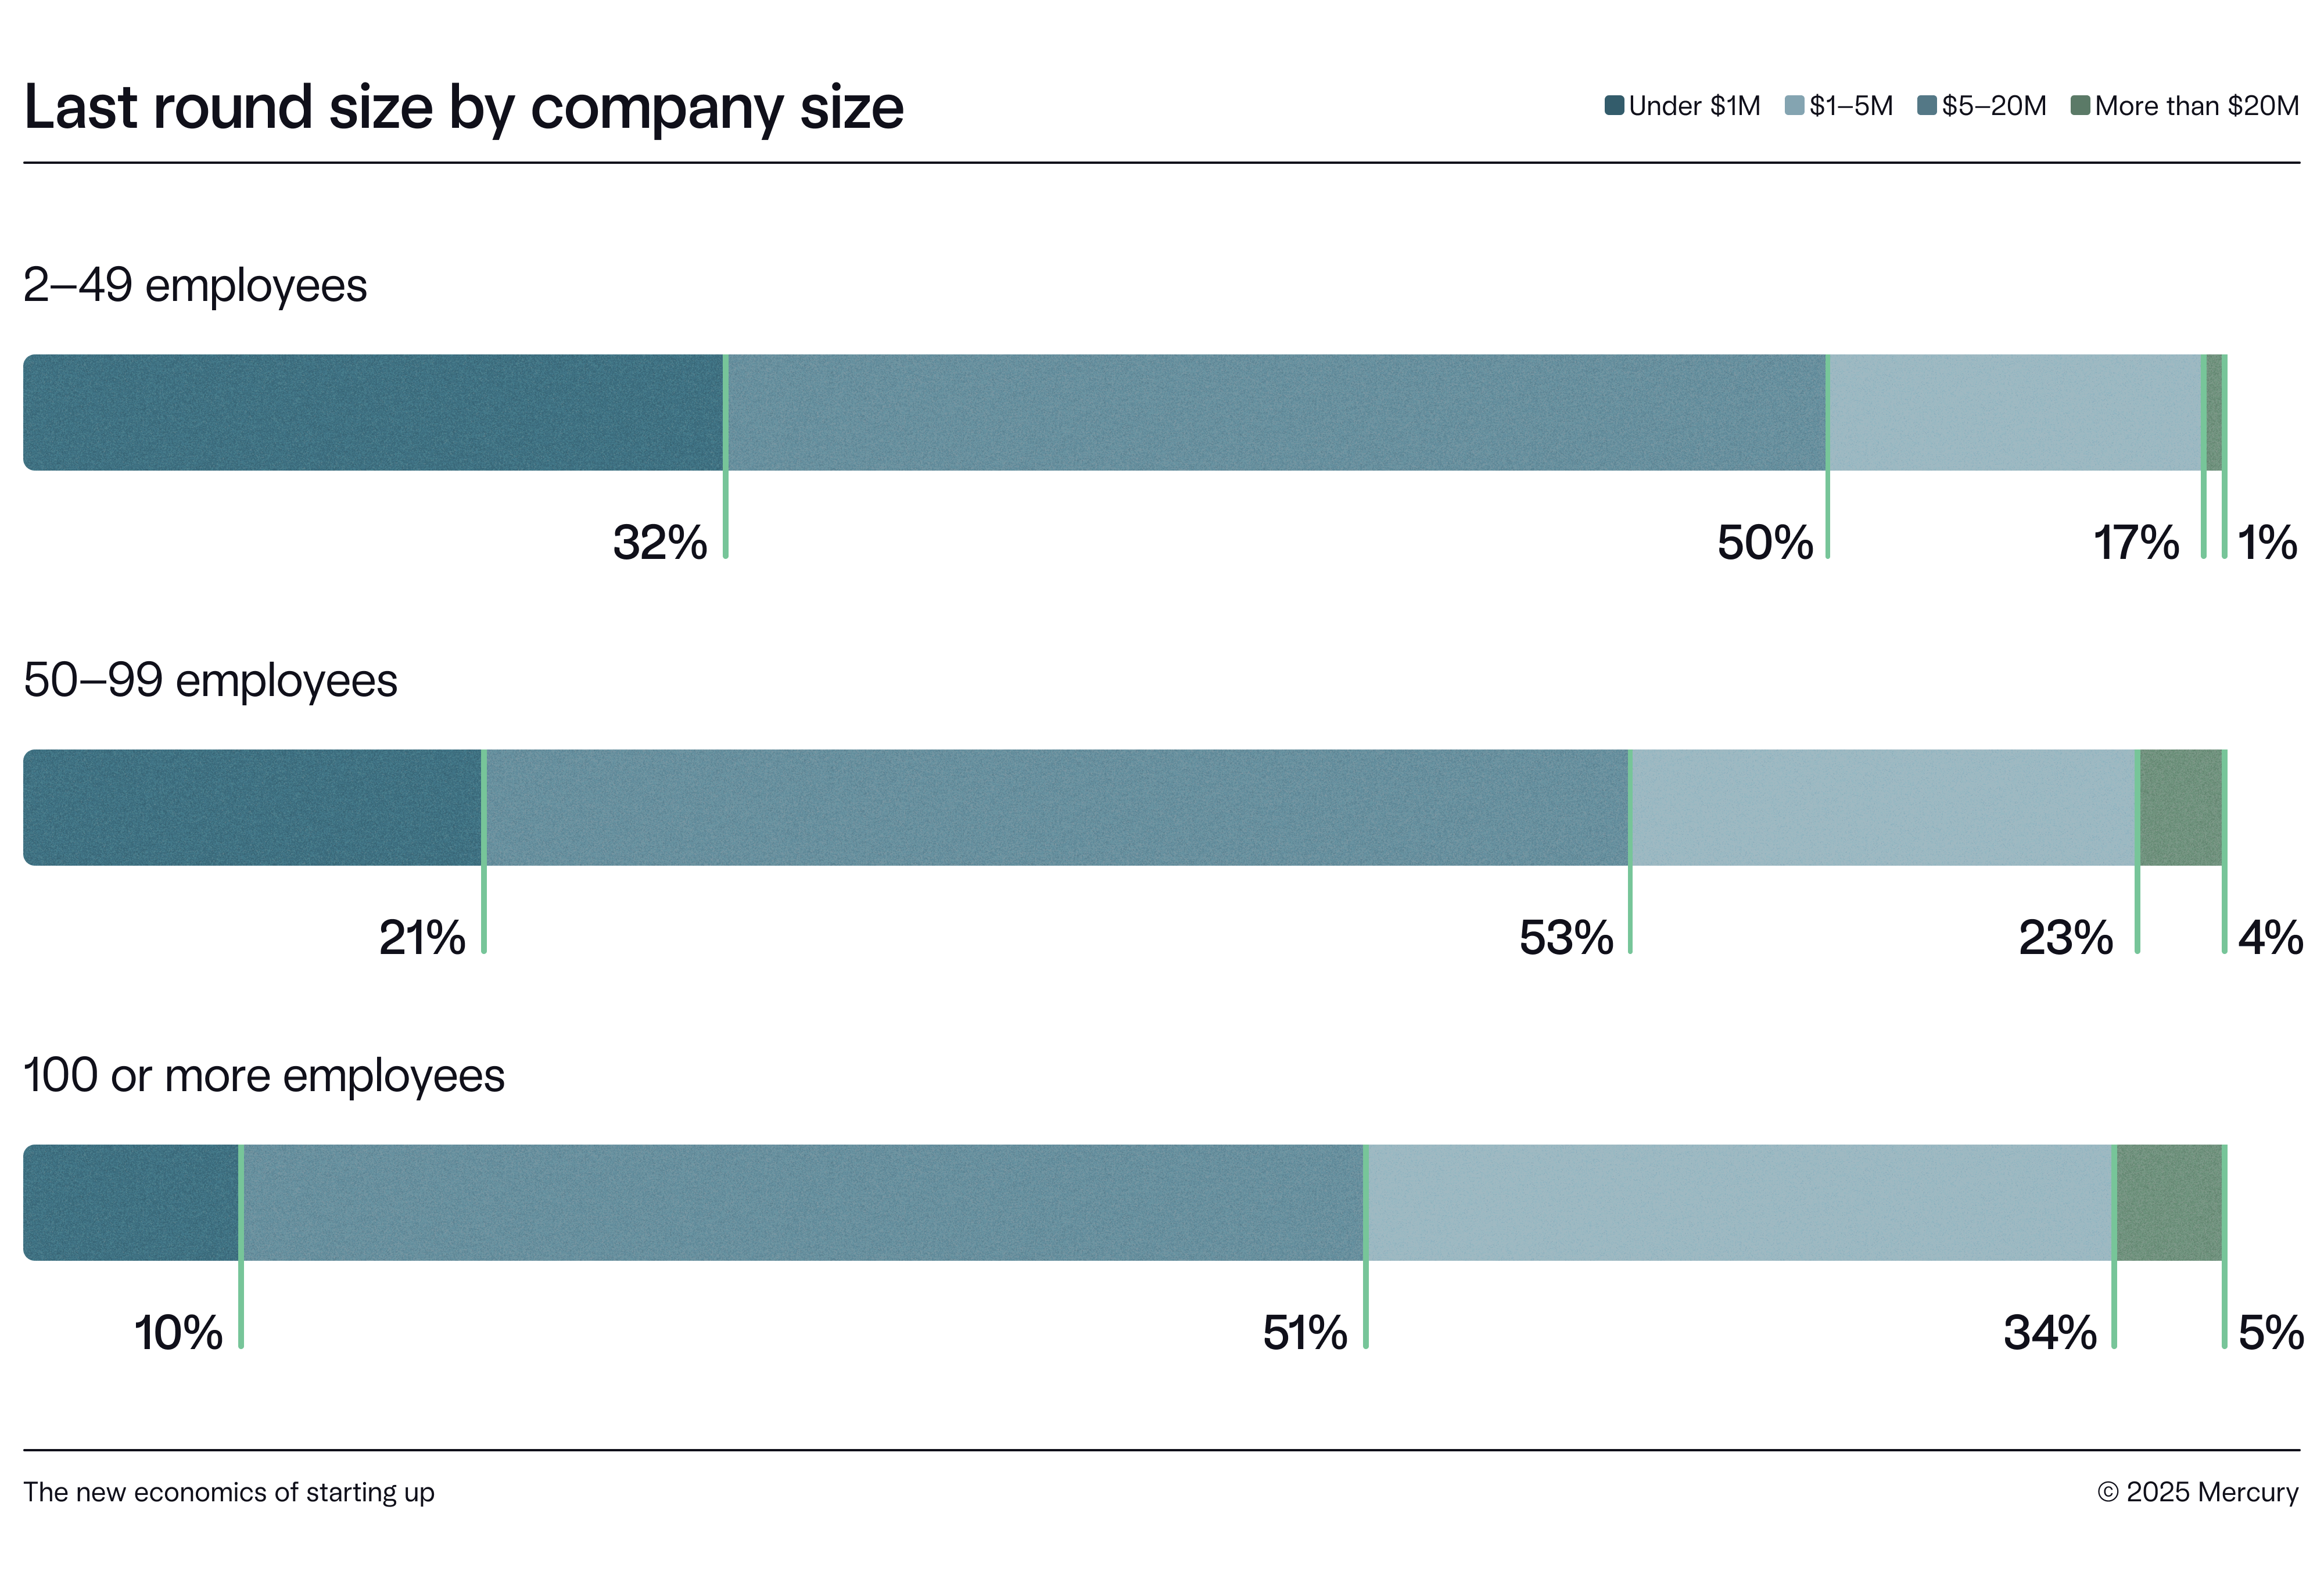
By the time companies reached 100+ employees, they were accessing significantly more capital: 34% raised $5–20M (double the rate of companies under 50 people). This was also the primary group raising $20M+ rounds. And if it’s surprising that some respondents at 100+ person companies raised under $1M in their last round, consider that they might have raised a small, strategic round to engage a particular investor or support a specific initiative — or they may not have raised at all since e.g., a small seed, angel, or friends and family round.
Does one source of capital cut it?
That also leads to a natural next question: Is one source of capital enough? Sometimes.
For smaller companies, a single source of capital usually sufficed (for now). But the bigger a company was, the more likely it was to combine multiple funding sources — and that diversification correlated with larger raises.
Companies using four or more funding sources and raising VC were 40% more likely to report a last round over $5M, compared to just 15% of single-track companies. These companies were also 3x more likely to raise $5–20M rounds (36% vs. 12%).
How funding strategies are changing
More than any other factor, entrepreneurs reported access to funding/capital (24%) as the number one thing limiting growth in their business. This was most acute for tech and ecomm businesses (both 29%) and professional services (28%).
59%
of surveyed entrepreneurs said recent market conditions are meaningfully impacting their approach to funding.
Indeed, 59% of founders said recent market conditions had a medium-to-large impact on how they approached funding or capitalization. That may at least in part explain why 66% of respondents changed their capitalization strategy in the past year — across all stages of early-stage growth.
As for what those changes look like, we saw that they varied based on company maturity:
- Younger companies (under 2 years) were most likely to seek larger rounds to fuel growth (58%).
- More established companies (5–6 years) were a little more conservative — only 43% were seeking larger rounds. These more mature companies emphasized extending runway between rounds (53%) and exploring alternative financing options (53%).
Overall, 33% of companies were looking to raise smaller rounds.
Who’s actually making money?
Of course, companies can also get money by making money. And the data revealed some interesting patterns about who’s actually generating revenue vs. just raising money.
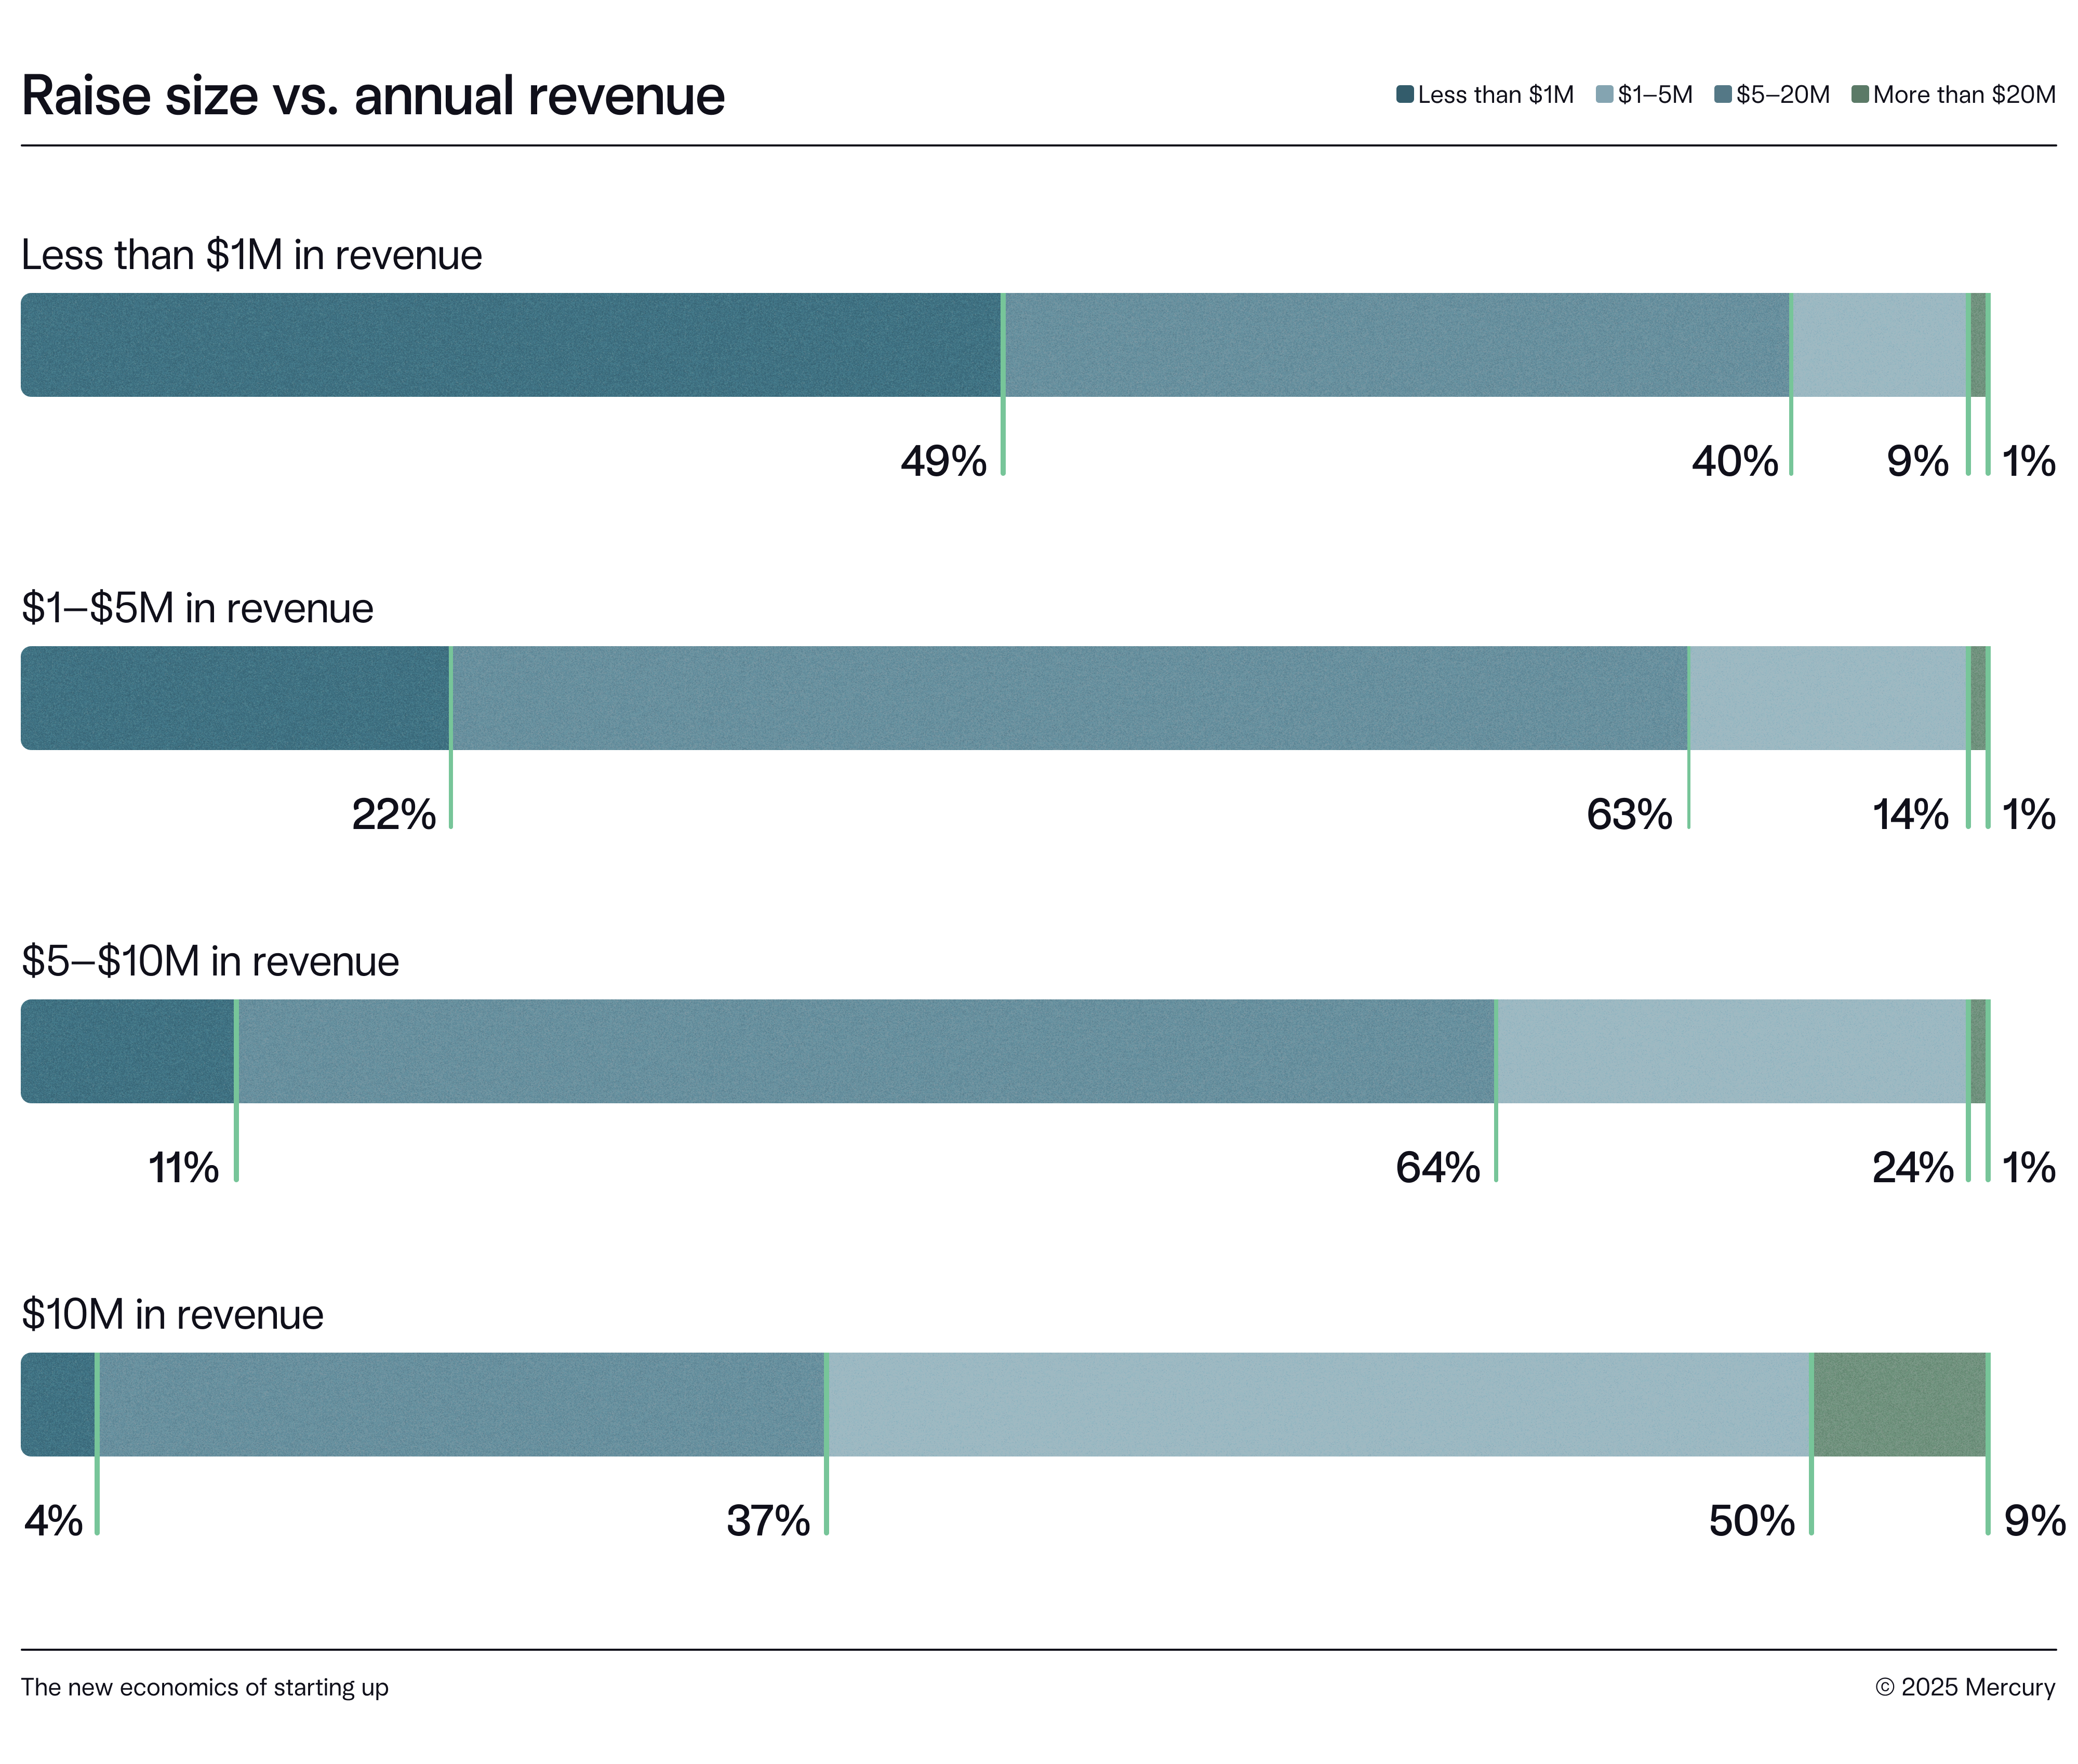
First, bigger rounds didn’t always translate to higher revenue. Among companies bringing in $10M+ annually, half had raised $5–20M rounds — but just 9% had raised over $20M. On the other end of the spectrum, nearly half (49%) of companies with less than $1M in revenue raised under $1M. This suggests these founders may be finding alternative paths to profitability — or simply operating leaner.
A sweet spot seems to emerge in the $5–10M revenue range, where 64% of companies raised $1–5M rounds. Disciplined growth paired with measured fundraising? We love to see it.
50%
of companies with $10M+ in annual revenue have fewer than 100 employees.
Team size tells another version of this story. More than half (54%) of companies with sub-$1M in revenue had fewer than 10 employees — scrappy, for sure. But scale changes the equation: among businesses with $10M+ in revenue, 50% had 100 or more employees. Solo founders, meanwhile, were almost exclusively clustered in the under-$1M group (making up 16% of that cohort), and not a single company with $5M+ in revenue operated as a solo venture. (We saw no signs of an impending 1–10 person billion dollar company… yet.)
We also spotted a few sharp patterns across industries:
- Retail seems to follow a “scale fast or fail fast” trajectory. Among companies pulling in over $1M annually, 35% were at least 5 years old — compared to just 8% of their sub-$1M peers.
- Professional services showed something similar, with 32% of $1M+ companies clocking in at 5+ years old, versus just 16% of sub-$1M firms. That tracks with the slower, relationship-driven growth curve of many agency or consultancy models.
- Ecommerce, however, told a different story. Among those hitting $1M+ in annual revenue, 55% were just 2–5 years old — but only 16% had made it past year five. That could signal rapid scaling success — but could also suggest some companies burn out before reaching long-term maturity.
- Financial services stood out for steady scaling: 56% of $1M+ companies in this group were 2–5 years old. That might suggest a more predictable revenue trajectory once product-market fit clicks.
Where’s the money going?
On spend, hiring, and tools
For early-stage businesses, things are often in flux — and the cost of pretty much everything was no exception.
A majority of respondents reported that in the last 12 months, costs were up across all areas we asked them about:
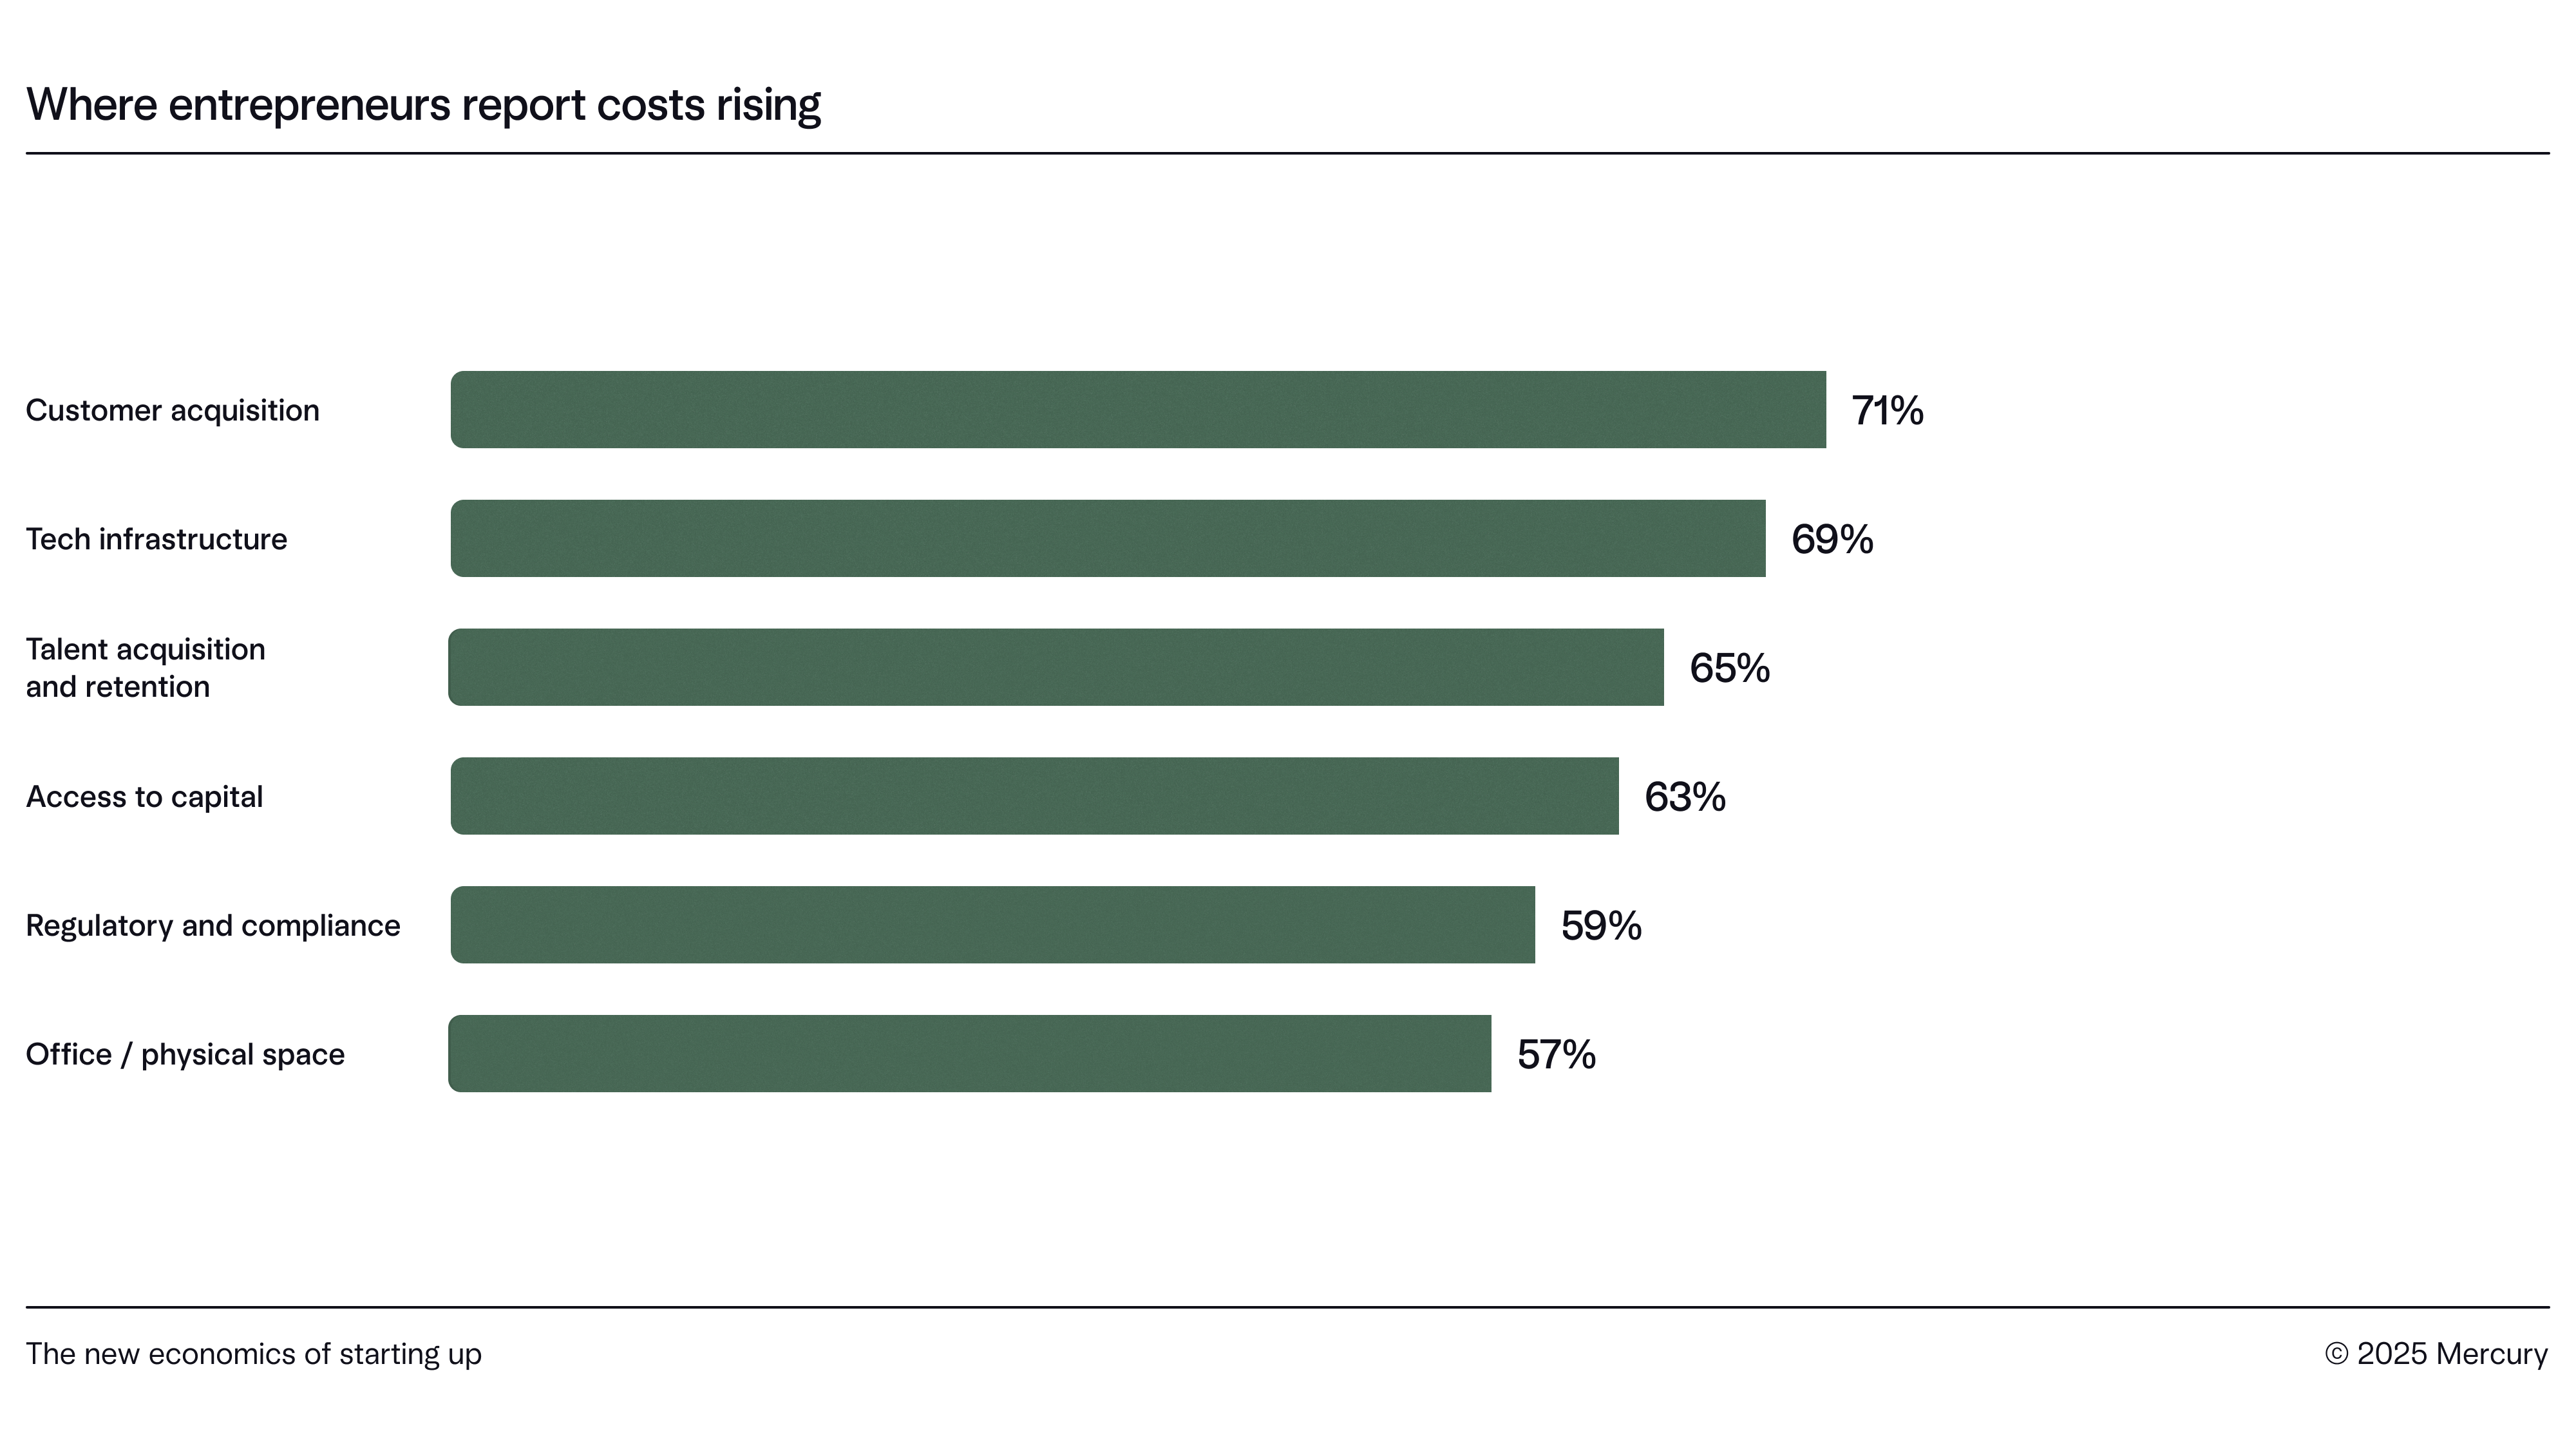
Most other respondents reported things had stayed roughly the same, save for a few percent here and there that reported costs had gone down. Cost of capital was the most reported decrease — though, still, just 8% reported a drop.
Costs weren’t always aligned with early expectations and projections, either. 66% of entrepreneurs said overall costs were somewhat or significantly higher than anticipated — with operations (27%) and sales and marketing (26%) the areas most often cited as over budget.
So maybe it’s no surprise that 79% of those surveyed — optimistic though they may be — expect to spend more in the year ahead.
79%
of early-stage businesses are increasing spend
18%
are keeping spend steady
2%
are decreasing spend
Companies in financial services (36%) and tech (34%) were most likely to plan significant spending increases. Other industries mostly planned to hold steady. Few planned to spend less, though ecommerce companies were 2–3x more likely than others to say they’re tightening budgets.
What’s driving the spend?
The number one reason behind companies’ increased spending was growth opportunity (29%); operational necessity was a semi-distant second (18%). At the bottom of the list was investor expectations (12%) — though, for tech companies, this was also most likely (38%) to rank amongst the top 1–2 reasons for ramping up spend.
The focus on growth echoed through spending patterns:
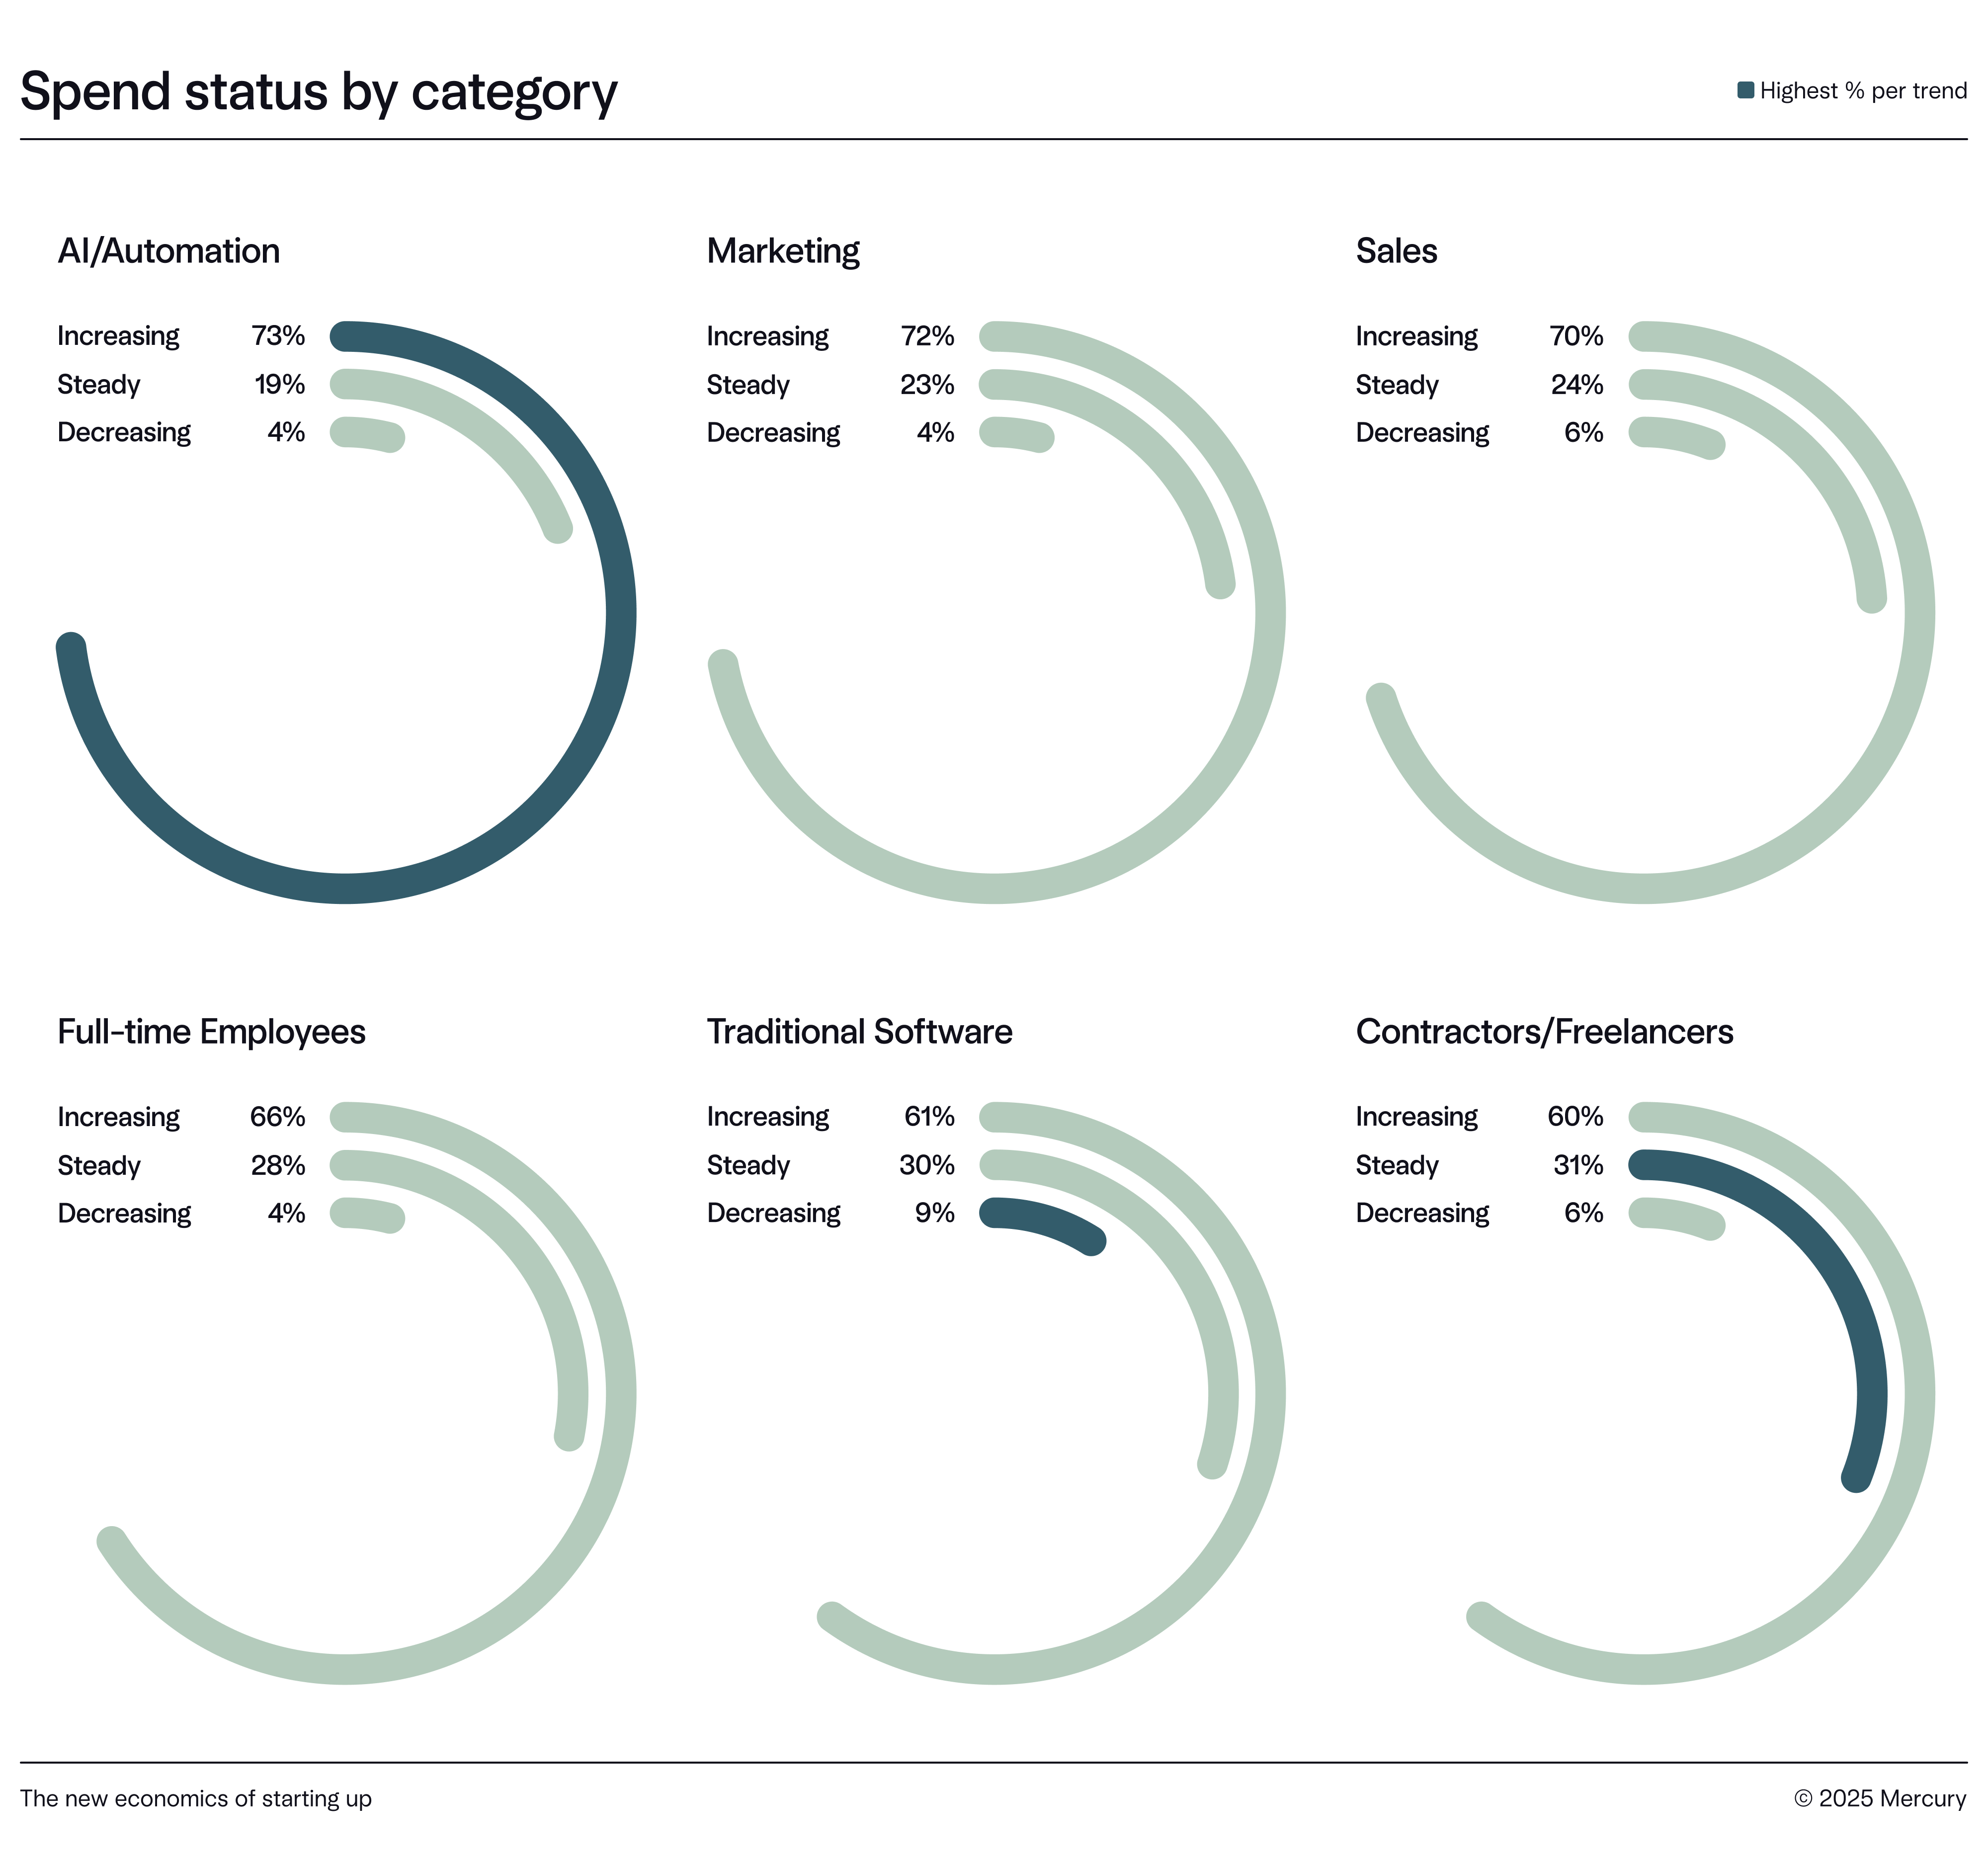
For a look at the true top of the leaderboard — some highlights of who reported plans to significantly increase spend in a particular area:
- Tech companies were most likely to be significantly increasing spend on AI/automation (49%).
- Manufacturing, financial services, and retail tied (33%) for biggest boosts in marketing spend.
- Retail companies also reported the highest percentage (33%) of significant spend increase on sales resources.
Hiring acceleration, not replacement
Although 65% of respondents said talent acquisition costs rose in the last year, it didn’t seem to be doing too much to slow down their hiring. In fact, when asked about the impact of market conditions on various areas of the business, hiring was the one most often left unchanged or only lightly adjusted.
Most surveyed companies were at least doing some hiring:
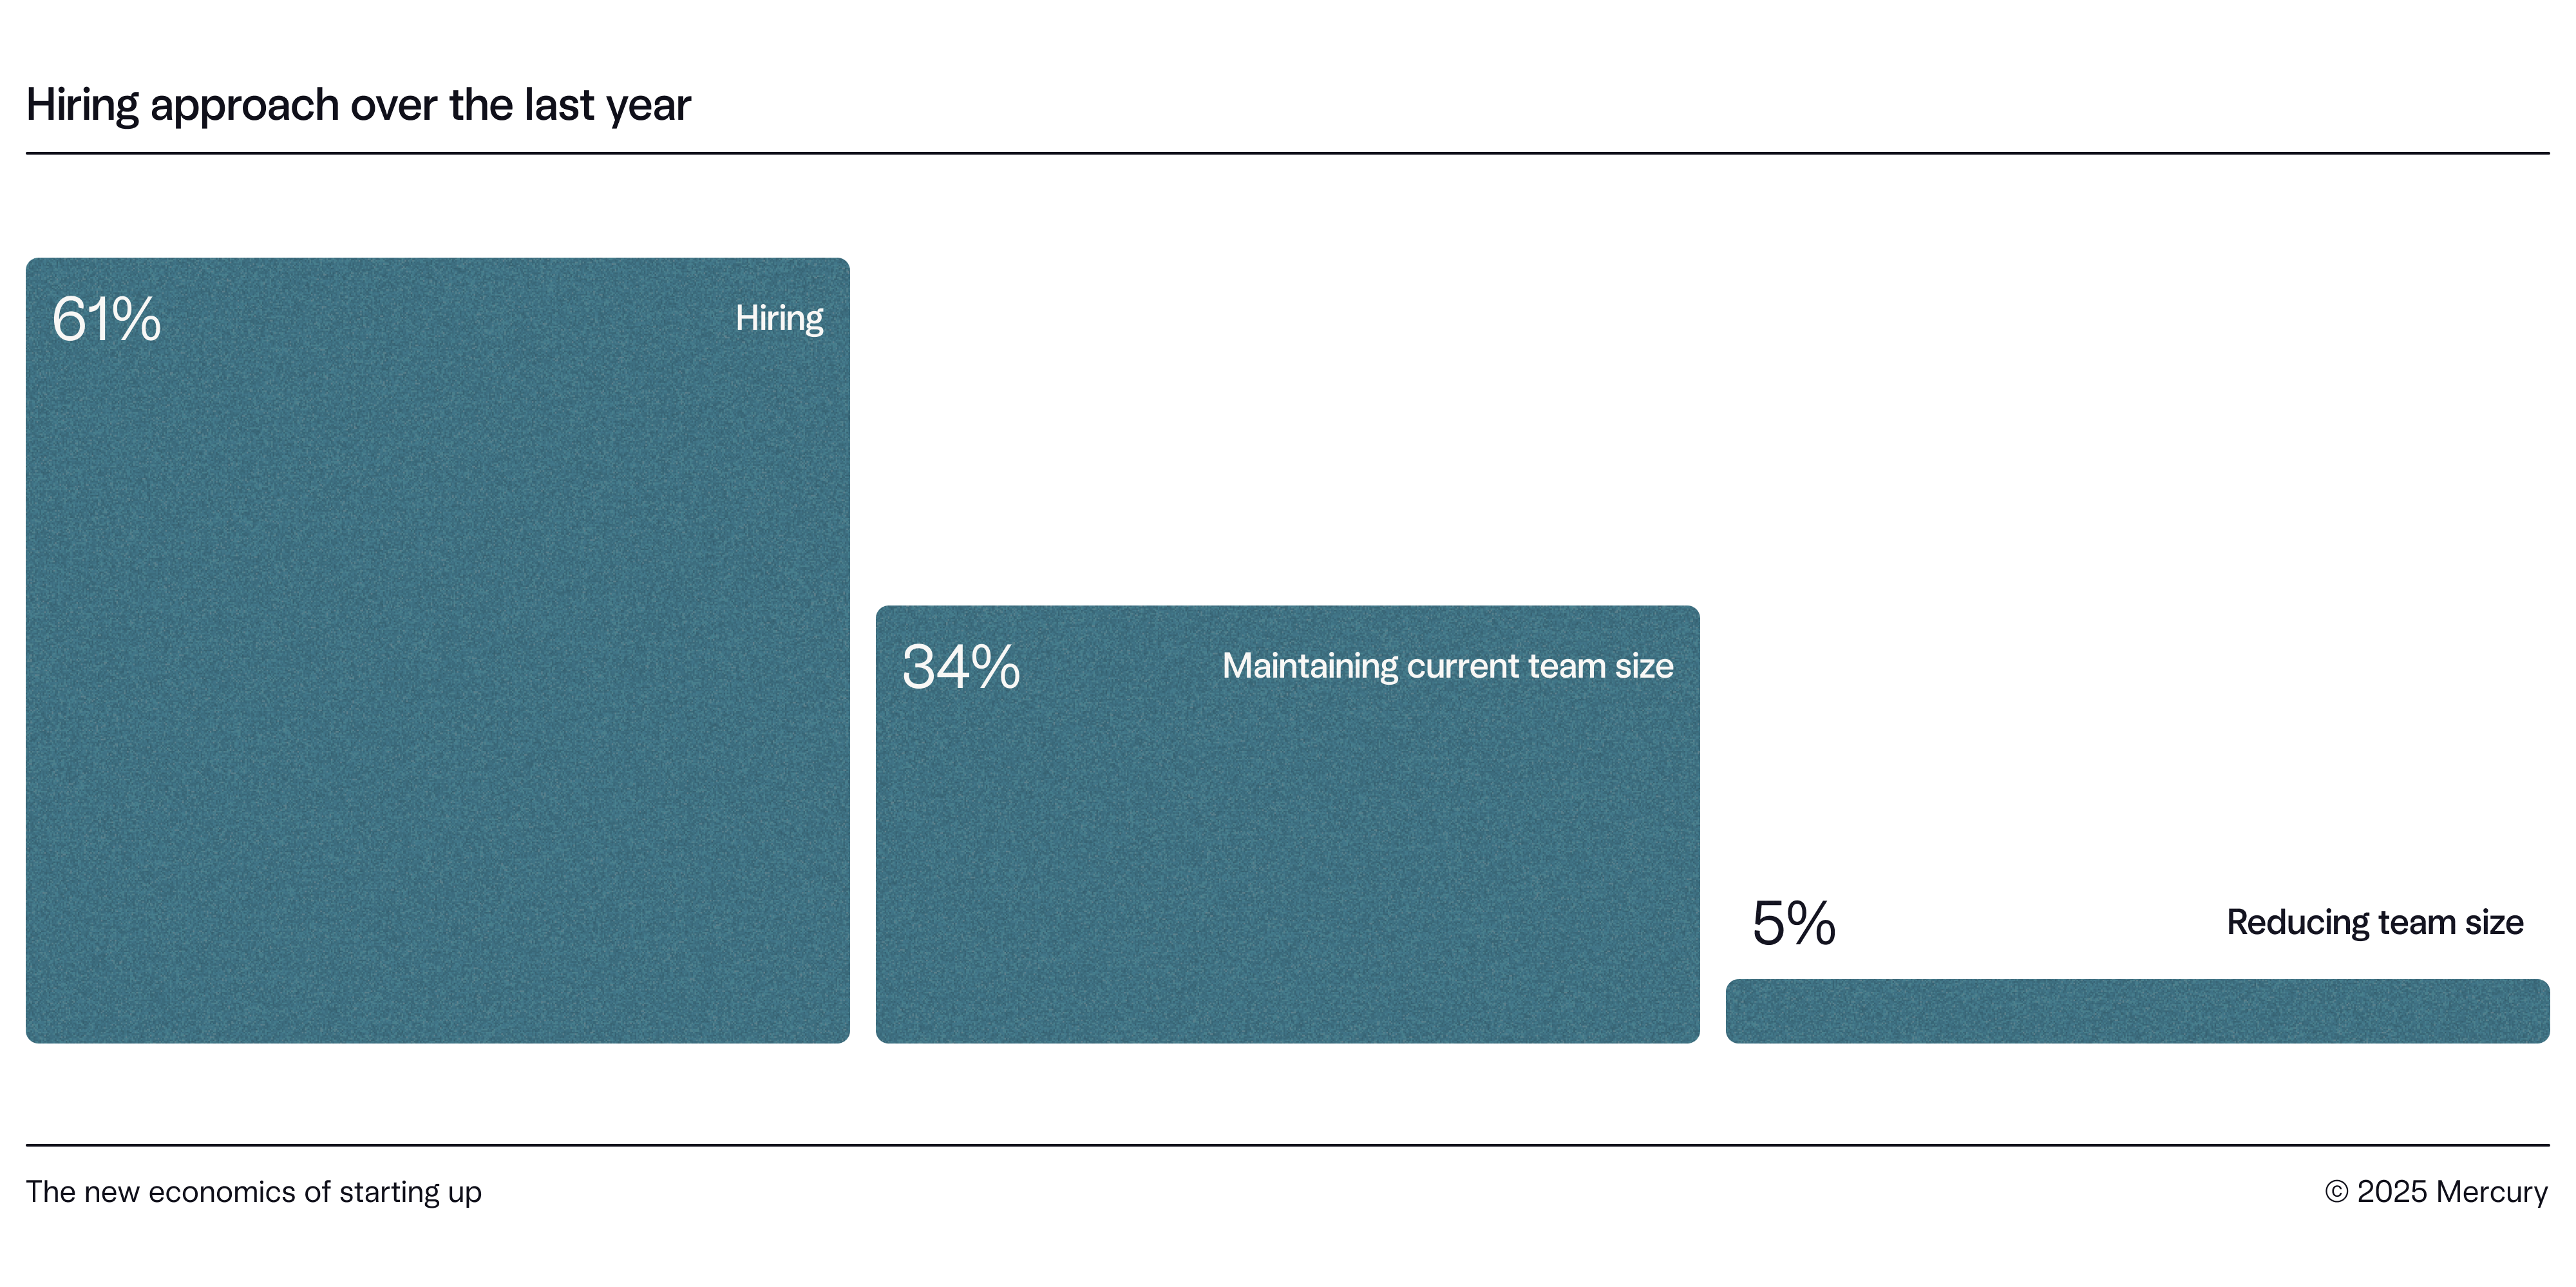
- Of those actively scaling team size (beyond just doing some hiring), ecommerce (39%) and manufacturing (34%) were most likely to be doing so.
- First-time founders were more likely (33%) to be actively scaling teams versus multi-time founders (21%).
79%
of surveyed companies with significant AI adoption are hiring more due to AI tools.
And job market doomers take note: 68% of companies using AI are actively scaling team size, which stands in pretty sharp contrast to the 13% of non-AI adopters actively scaling their teams. Moreover, 79% of companies with significant AI adoption said they’re hiring more because of it, and 61% of those who’ve had at least some AI adoption said the same. Moreover, only 3–4% of those AI users said they’re hiring some version of less.
Notably, AI-adopting companies reported increased hiring across growth-oriented roles:
- 44% business development
- 43% sales
- 42% marketing
- 42% customer service
Could these companies be using their AI efficiency gains to expand market reach rather than just maintaining current output with fewer people? 👀
Some breakdowns of the top 3 hiring areas by industry offer more nuance:
- Retail/Wholesale AI adopters are doubling down on customer-facing roles — 59% are hiring in sales, 50% in customer service.
- Professional services are leaning into relationship-building — hiring in biz dev (48%) and marketing (47%).
- Manufacturing showed elevated hiring in legal/compliance (21%), potentially reflecting AI’s regulatory impact.
- Financial services focused heavily on, interestingly, finance (61%), with low hiring in design (8%) and EPD (12%) — suggesting AI is reinforcing core functions more than enabling digital transformation.
Contractor-enabled scale
While many of these early-stage companies are prioritizing full-time hires, a majority are also turning to freelancers and consultants to fill gaps and stay nimble. 61% of those surveyed said their company is “very reliant” or “reliant” on contract talent, a model that seems to increasingly be a defining feature of modern startup operations.
And what are the top reasons respondents are choosing contractors?
64%
expand capacity quickly and flexibly
32%
avoid or delay hiring full-time employees
32%
work with international talent
28%
work is temporary or not full-time
18%
can't find the right full-time hires
Writ large, contractor usage was touted as a way to access specialized skills without long-term commitments — flexibility that could prove a strategic advantage in a less-than-predictable economy.
The data also showed some splits when looking at contractor usage in relation to AI adoption:
- AI-adopting companies showed significantly higher contractor usage across most business functions — particularly in growth-driving areas like sales and marketing. Non-AI adopters, however, leaned more on contractors for operations.
- 38% of entrepreneurs who said their company’s AI adoption was significant said they use contractors to access global talent, more than 2x the rate of non-AI adopters (15%).
- On the flip side, non-AI adopters were more likely to use contractors for temporary work needs (38% vs. 27% for AI adopters), suggesting some differing strategic approaches to workforce flexibility.
Here’s how these contract roles shake out by function:
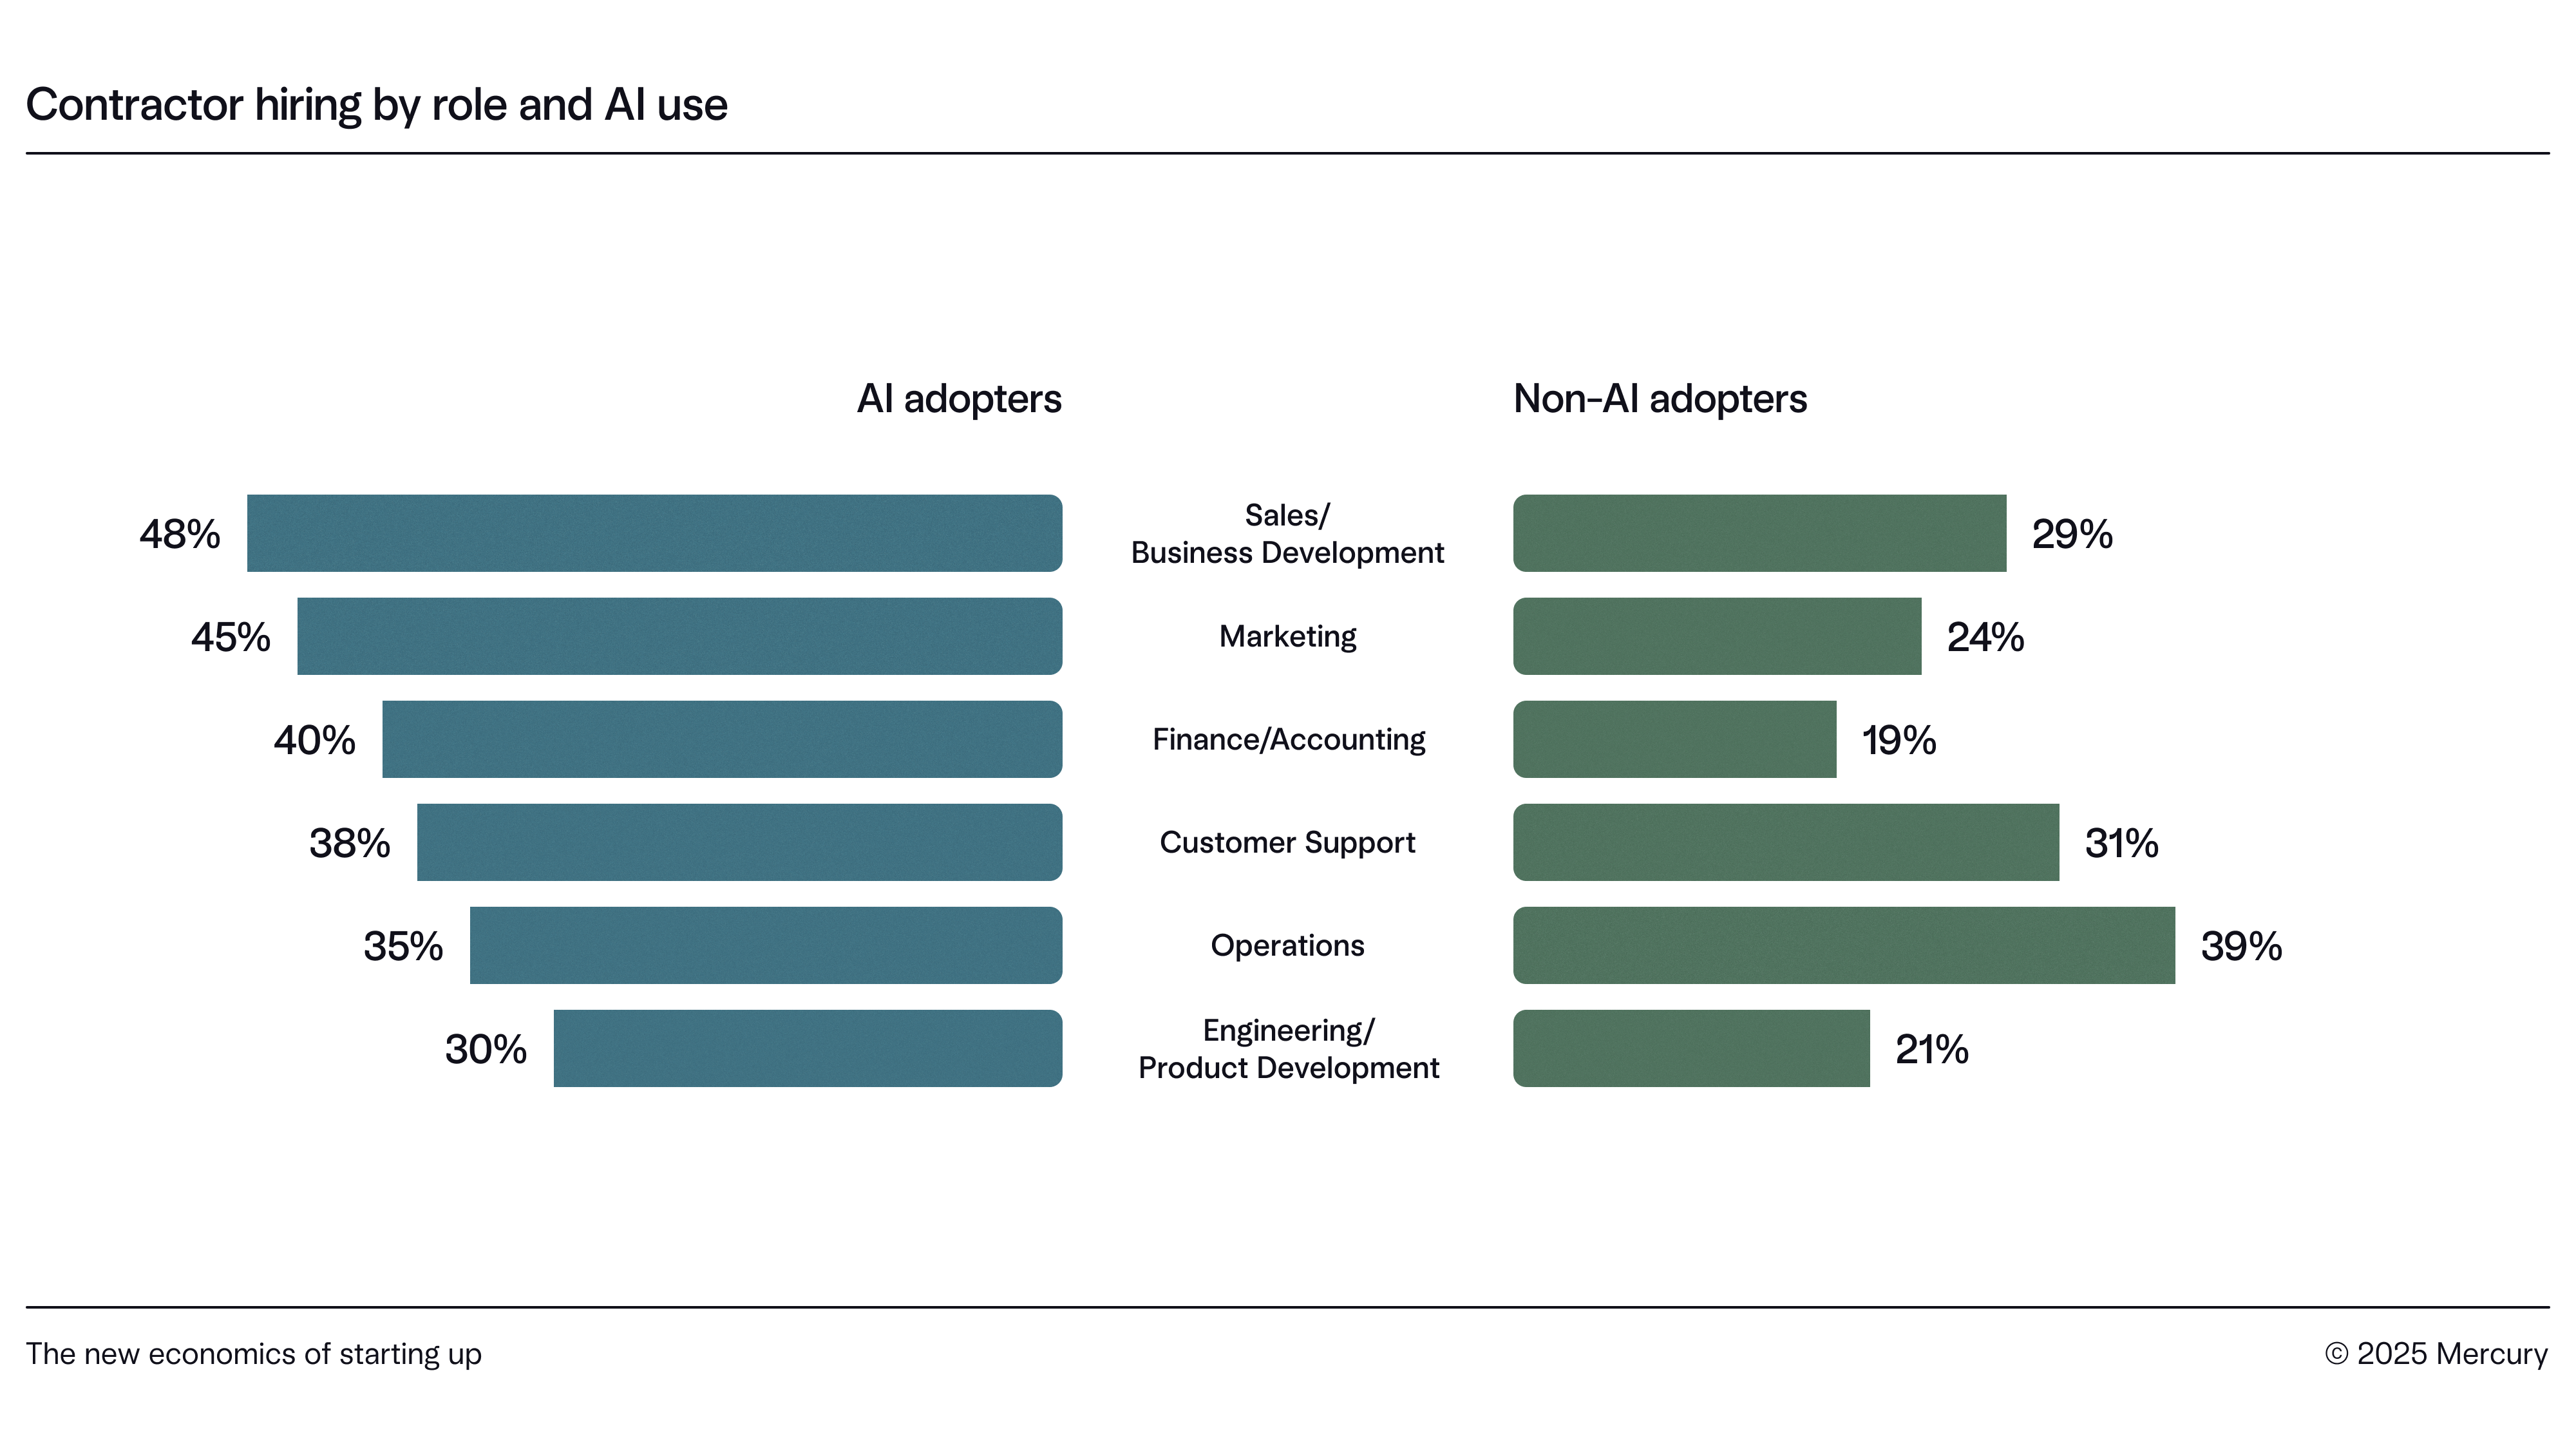
In short: AI adopters seem to be more likely, overall, to use contractors, and more likely to deploy them in pursuit of growth. Non-AI adopters seem to be using them to keep the lights on a bit more, deploying them for functions like ops and customer support.
~4X
AI adopters’ likelihood to be “very reliant” on contractors, vs. non-AI adopters.
It’s also a question of degree. 45% of significant AI adopters said they’re “very reliant” on contractors, compared to just 12% of non-AI adopting companies — nearly a 4x difference.
- 69% of companies with significant AI adoption reported using contractors “much more” or “somewhat more” in the past year, compared to other companies, where contractor usage has remained largely static.
- Only 5% of these same companies said they were reducing contractor reliance.
Taken together, these patterns suggest contractors are an increasingly essential component of team building today — especially for AI-forward companies that take a global view on talent.
The policy pinch
Market conditions and personal optimism weren’t the only thing reshaping companies’ spending in different areas — policy changes played a role, too. Out in the wild, we’d heard founders mention one tax issue — the amortization of R&D costs — as having an outsized negative effect since it took effect in 2022. So we dug in, and the numbers were clear.
73% of founders said the R&D amortization change had a negative financial impact on their business. While it was neutral for some, not a single respondent reported a positive one.
For many, their pain translated into real tradeoffs. 44% of impacted respondents said it had forced operational changes, including:
52%
Cutting R&D budgets
43%
Slowing or reducing hiring
42%
Delaying or canceling projects
31%
Offshoring innovation
21%
Implementing layoffs
Perhaps unsurprisingly, this hit bigger companies harder, as they may be more likely to be doing something qualified as R&D. Among businesses with 100+ employees, 57% reported operational changes due to the amortization policy — suggesting the burden landed most squarely on companies in the critical scaling stage, when investment and hiring typically ramp up. Ouch.
Businesses should see some relief in this area soon, as the issue was addressed as part of the tax bill passed through Congress in July 2025.
Spending on tech and tools
Even as business costs rise and economic sentiment swirls, early-stage companies are still spending — especially on tools that can help them grow smarter and faster.
61%
of early-stage companies are increasing their tech spend.
The top line: 61% of companies said they’re increasing their technology spend, with 24% “significantly increasing” and another 37% “somewhat increasing.”
51% of companies reported expanding their tech stack, rather than consolidating or holding steady. But companies are also looking to expand with intention: 56% said they’re becoming more selective about new tools.
And where’s their tech spend going? Toward the future:
- Respondents were most likely (73%) to be somewhat or significantly increasing spend on AI tools and technology — maybe no surprise since 83% of those using AI said it had somewhat or significantly higher ROI than “traditional” alternatives.
- 55% of companies said they’re shifting budget from traditional to AI tools — making deliberate tradeoffs in pursuit of efficiency, speed, or both.
These shifts were especially pronounced in larger or more mature companies:
- 62% of companies with 100+ employees said they’re reallocating spend toward AI tools.
- So did 61% of companies aged 5+ years.
At the industry level, tech companies were most likely (72%) to be shifting budget toward AI tools, but at least 50% of respondents in each industry said the same — signaling that AI investment isn’t limited to Silicon Valley.
Of note: solo founders were only half as likely (31%) to shift budget toward AI. There could be plenty of reasons for this, but it might also highlight how limited runway can constrain adoption, even if interest is high.
Putting it all together
Despite rising costs, shifting policies, and persistent macro uncertainty, the early-stage ecosystem is surprisingly buoyant. Optimism is high — especially among companies that have embraced AI and diversified funding models — and founders are looking to deploy flexible strategies to keep building in what might otherwise feel like a rocky environment.
And the 32-point confidence gap between significant AI adopters and non-adopters aligned to real behavioral differences. AI-forward companies were:
- 3x more likely to be actively scaling their teams
- 2x more likely to be seeking larger funding rounds
- More likely to expand spend, hire faster, and deploy global contractor talent
Put simply, the rules of startup economics are changing, and technology is, no surprise, playing a significant role. These entrepreneurs are rewriting the playbooks in real time, using new tools and strategies to move faster, grow, and, perhaps, bet big when the moment’s right.
Thank you to Stephanie Baumann, Adam Berg, Celeste Carswell, Helen Chacon, Nic Corpora, Ryan Craggs, Amaara Dhanji, Jordan Horsman, Kelsey Marksteiner, Heather MacKinnon, Dani Moalem, Sarah Mohammadi, Rachel Oatway, Sid Orlando, Tamara Rahoumi, Andrew Shen, Dan Swislow, and Devon Watts for contributing to this report.
Ready to get building?