What is unit economics, and does it matter for your startup?

CFO at Mercury.
TL;DR
- Unit economics measures per-unit profitability using two main approaches — per-item sold (where contribution margin is the key metric) or per-customer (using LTV, CAC, and payback period). The right framing depends on your business model.
- LTV estimates the marginal profit a customer generates over their entire lifetime, driven by retention, pricing, and costs — though it relies heavily on forecasting and segmentation assumptions that can shift as your customer base matures.
- The LTV/CAC ratio signals growth efficiency: a ratio below 1 means you're losing money on every customer acquired, while a ratio of roughly 3:1 is generally considered strong — though ratios much higher than that may actually indicate underinvestment in growth marketing.
- Payback period matters beyond pure profitability — it directly affects how cash-intensive your business is and how comfortably you can manage cash flow between acquiring customers and recouping that initial investment.
- Investors use unit economics to judge growth quality and long-term viability, but the same metrics also drive internal decisions around budgeting, pricing, product investment, and broader business model optimization.
When you’re in the thick of building your business, the term “unit economics” may either 1) feel too granular to be important, or 2) sound too complicated to tackle when your bandwidth is already limited. The truth is: a unit economics analysis is critical in determining whether or not you have a sustainable business model, and can provide unrivaled insights into your company’s successes and shortcomings — regardless of its size or stage.
What’s more, a solid understanding of your company’s unit economics is necessary when it comes to communicating with investors. Not only should you be prepared to answer questions around your company’s unit economics, you should also be prepared to provide related data points.
What is unit economics?
Put simply, the term “unit economics” refers to measuring a company’s profitability on a per-unit basis.
These “units” refer to any quantifiable item that brings revenue to your business, such as a product that you sell or a subscription package. A unit economics analysis involves measuring revenue and costs in relation to an individual unit. That said, it’s important to keep in mind that how one business chooses to measure unit economics may differ from another business’ method based on what information is most applicable to the success of their business. And in most cases, there is more than one type of “unit” available for measure.
For example, if you own a donut shop, investigating your business’ unit economics could involve measuring revenue and costs in relation to an individual unit of what you sell — which, in this hypothetical case, would be one airy unit of deep-fried dough. Applying a unit economics analysis to a SaaS company, on the other hand, would look different. In this case, once a customer subscribes to a software service, they tend to generate recurring revenue for the company in question with minimal additional costs to the company over the course of their time as a customer. So, instead of asking yourself, “Can we make more from selling a donut than we lose by making one?”, you’d likely ask yourself, “Can we make more from a customer before they unsubscribe than the amount we spend in acquiring them?” In this case, it follows that the most useful unit economics analysis for a SaaS company would likely involve measuring revenue and costs associated with one customer (i.e., “one unit”).
Over the course of a company’s lifetime, its unit economics will inevitably change — whether due to economic conditions or competitive pressures. It’s important to keep a pulse on these changes (i.e., by regularly analyzing your unit economics) from day one in order to optimize your business model as your startup scales.
When it comes to a practical application of unit economics, however, we recommend going further. Breaking down your startup’s unit economics into the following five tenets will give you a deeper understanding of your business, not only helping to inform your decisions but also helping you to paint a clear picture for investors.
The five tenets of unit economics
- How much revenue your company makes per unit sold
- Your gross profit from that revenue after you factor in the cost of goods sold (COGS). Calculate your product's gross profit margin here.
- How much gross profit you generate off a customer over that customer’s expected lifetime (LTV)
- How much that LTV is worth in comparison with how much it cost to acquire that customer (CAC) — as well as how much time it takes, on average, to make up for the money spent in acquiring that customer (this is known as “payback period”)
- How profitable — on a high level — a specific business line is when you factor in not only CAC and COGs, but additional marginal costs associated with serving a new customer (e.g., customer support or database costs)
How can you calculate your startup's unit economics?
Again, there isn't a single right way to calculate unit economics, and the method your company chooses to go with will largely depend on the nature of your business. Below, we breakdown some of the specifics around the two primary methods of calculating unit economics.
Method 1: One unit = one item sold
If you choose to define a unit as “one item sold” — as in the case of our donut shop example above — you’ll want to calculate the contribution margin, which is a ratio based on the revenue your business generates from one sale, minus the costs of making that sale. Here’s how you would calculate it:
- Contribution margin = revenue per unit - variable cost per sale ÷ revenue per unit
So, for example, if each donut from your donut shop brings in $5 of revenue and your variable costs to make that donut are $2, your contribution margin would be:
- 5-2 ÷ 5 = 0.6 or 60%
Once you’ve calculated your contribution margin, you’ve calculated your business’ unit economics for this specific type of analysis. The higher the contribution margin, the better, as it means that your company has more money to cover fixed overhead costs.
Method 2: One unit = one customer
If you choose to define a unit as “one customer” — which is usually the preference for larger, more complex companies that don’t sell identical “units” (and therefore, likely the most effective approach for most startups) — there are three common metrics you’ll want to pinpoint in order to understand how sustainably your startup can grow and acquire customers profitably over time. These metrics are lifetime value (LTV), customer acquisition cost (CAC), and what is known as “payback period.”
Before going into the relationship between these metrics and the right equations to determine unit economics, we’ll break down each metric individually.
Digging into the metrics related to calculating unit economics
Understanding the different equations for calculating unit economics is part of the puzzle, but you also have to understand the different pieces of those equations. Here, we go a bit deeper into the different metrics mentioned above.
Customer lifetime value (LTV)
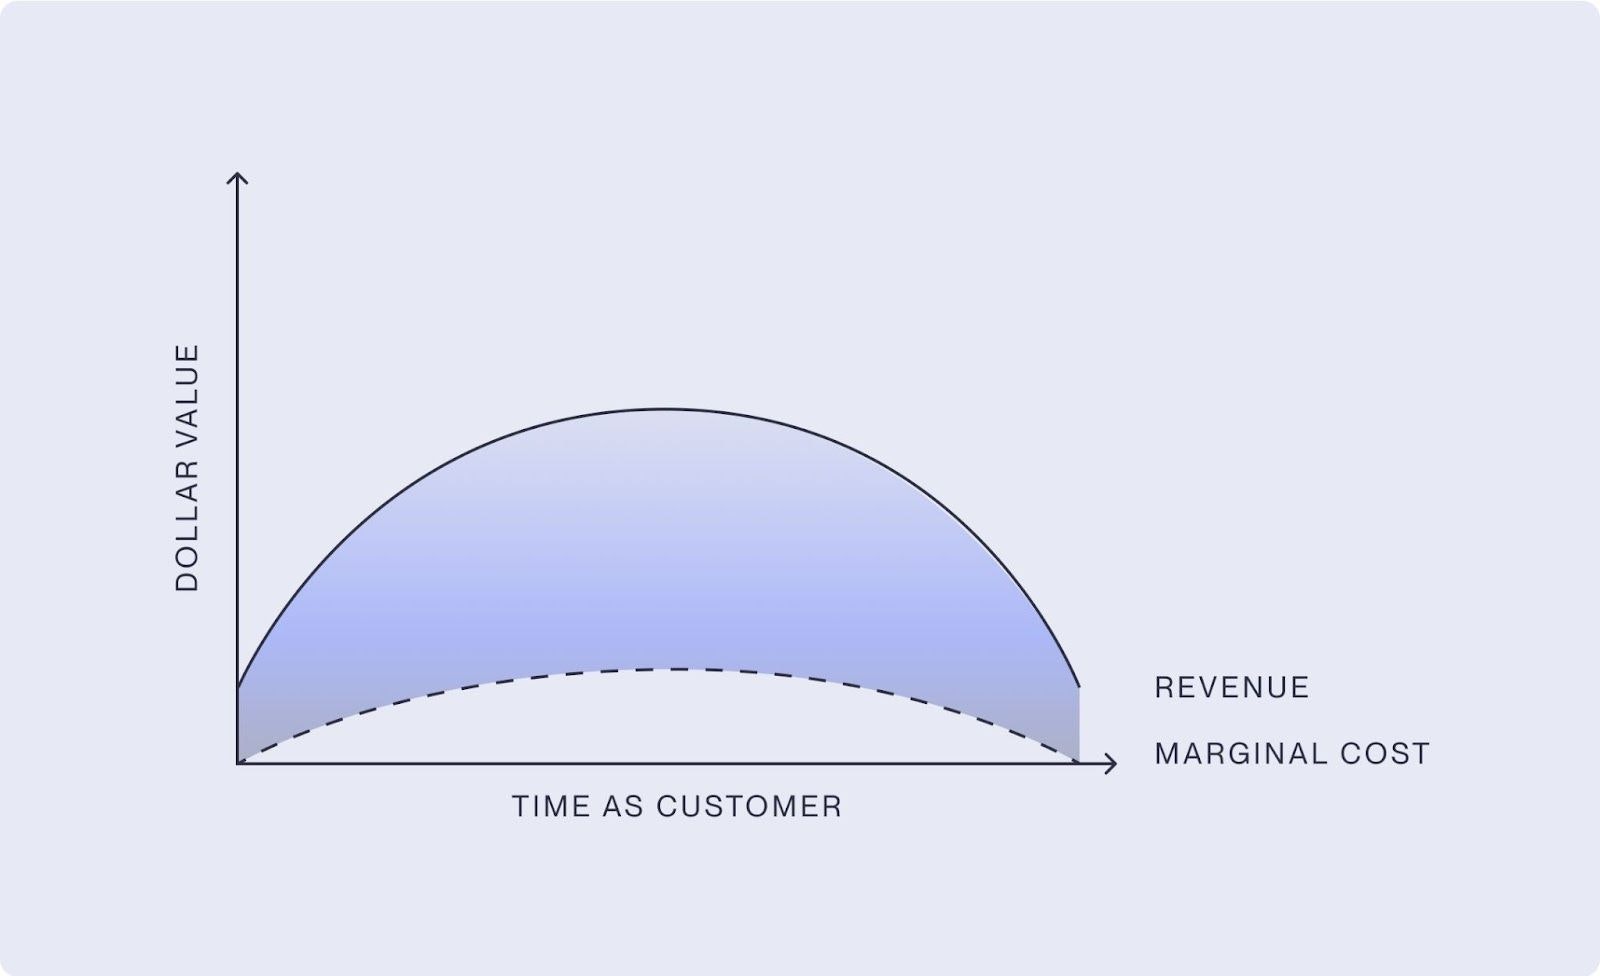
LTV is a measure of how much marginal value, or profit, a customer provides over the course of their entire lifetime as a customer. Depending on your business model, LTV per customer can vary greatly. As a result, LTV is often assessed on a cohorted and/or segmented basis in order to gather more useful insights (that said, it’s important to be wary of large outliers that can skew this metric).
LTV ultimately comes down to the relationship between a few different components:
- Revenue or ARPU (average revenue per user): This refers to the amount of revenue customers in a given cohort/segment generate on average over a specified period of time, such as monthly. Understanding ARPU requires a knowledge of how ARPU for the same set of customers can change over time due to cross-sells or up-sells — and in the case of transaction-driven revenue models, also how transactions can grow over time.
- Cost of goods sold (COGS): This refers to the direct costs of producing goods sold by a company. It includes things like the cost of materials and labor, but excludes indirect expenses.
- Marginal cost: Marginal cost factors in the variable costs that go into servicing or acquiring a new customer. This considers COGS, but adds to the equation any costs that scale as your customer base grows, such as customer support or database costs.
- Lifetime: In the case of a SaaS startup, you’ll generate revenue from your customer over some period of time (the period of time that they are retained as a customer), which is that customer’s lifetime. Ultimately, this metric is reliant on your own forecasts. Understanding retention curves for a given cohort/segment can prove useful in modeling lifetime for that cohort/segment.
With those different factors in mind, a simple way to visualize LTV is as the delta between revenue for the given cohort/segment expected over their time as a customer, as illustrated by the graphic below.
This may be obvious by now, but understanding LTV isn’t a very simple calculation because many of the inputs require forecasting. You could wait a few years in order to generate more accurate data and avoid forecasting, but this isn’t the best approach because you want to understand a cohort’s LTV as close to the point of acquisition as possible.
Depending on how much reliable data you have, there are various statistical data models you can use to build more accurate LTV forecasts — that said, these models will still require you to make some judgment calls around your customers’ prospective behavior and product usage.
Ultimately, your LTV calculations and their usefulness will depend on how thoughtful your inputs and assumptions are. Over time, you’ll have access to more data, which will help you build even more confidence in your LTV numbers, assuming that past trends can help you project into the future. At scale, most companies do see a normalization of metrics like retention curves, for example, because product data is a reflection of human behavior and product-market fit.
Forecasting lifetime when measuring LTV
When measuring LTV, you’ll also need to determine how far out to forecast the lifetime period. There are two schools of thought on this:
- Forecast into perpetuity and apply a discount rate to the expected cash flows based on your cost of capital (akin to a discounted cash flow model).
- Bypass the discount rate and set a finite window of say, 3–5 years. The exact window you choose will depend on your business and the retention rates you expect to see for your type of product (e.g., if your business consists mostly of one-time transactions, a five-year window probably wouldn’t make sense).
We recommend the second approach to avoid layering on additional assumptions to what’s already a complicated calculation based on best guess estimates. The first approach can also lead you to underwrite heavily to future-weighted outcomes that may not materialize, potentially causing you to overpay for customers. That said, this approach can make sense when you’re a more mature company with years of data and consistent results to go off of.
NOTE: In calculating your LTV, a strong data analytics focus is critical. It will help you to quickly understand how much revenue each customer is generating and then ensure customers are tagged in a way where you can quickly perform cohorting and segmenting analysis.
If you’re just getting started, this doesn’t need to involve fancy data lakes and data scientists. Even a well-maintained spreadsheet can help you track this info in your early days as you build out your tech stack.
Customer acquisition cost (CAC): Measuring CAC is usually a lot more straightforward than measuring LTV. Put simply, CAC is the average cost of acquiring a customer in a given cohort/segment, and is often assessed per acquisition channel (e.g., organic, sales, Google Ads, etc.).
The calculation is simple: take the total expenses associated with a given channel over the period of time you’re assessing, and then divide that number by the total number of new customers acquired during that period of time within the same channel.
For example, if your company spent $500K on Google Ads in a given month and also acquired 500 customers from Google Ads over the course of that month,, your Google Ads CAC for that month would be $1,000. On a larger scale, if your company spent $1.2M on all marketing efforts over the course of a month and you acquired 4,000 customers over the course of that month, your company’s total CAC would be $300.
Sometimes, it can be tricky to attribute a customer to a specific sales channel, because that customer may have first seen an ad, then talked to a sales rep, etc., making it difficult to say their acquisition had a single origin — but on the whole, what’s most important is to aim for accuracy.
LTV/CAC
Now that we have a better understanding of LTV and CAC, let’s talk about the significance of LTV divided by your CAC, which is a calculation that can help you understand how much value is generated for your business per dollar that you spend on growth.
Customer lifetime value ÷ customer acquisition cost
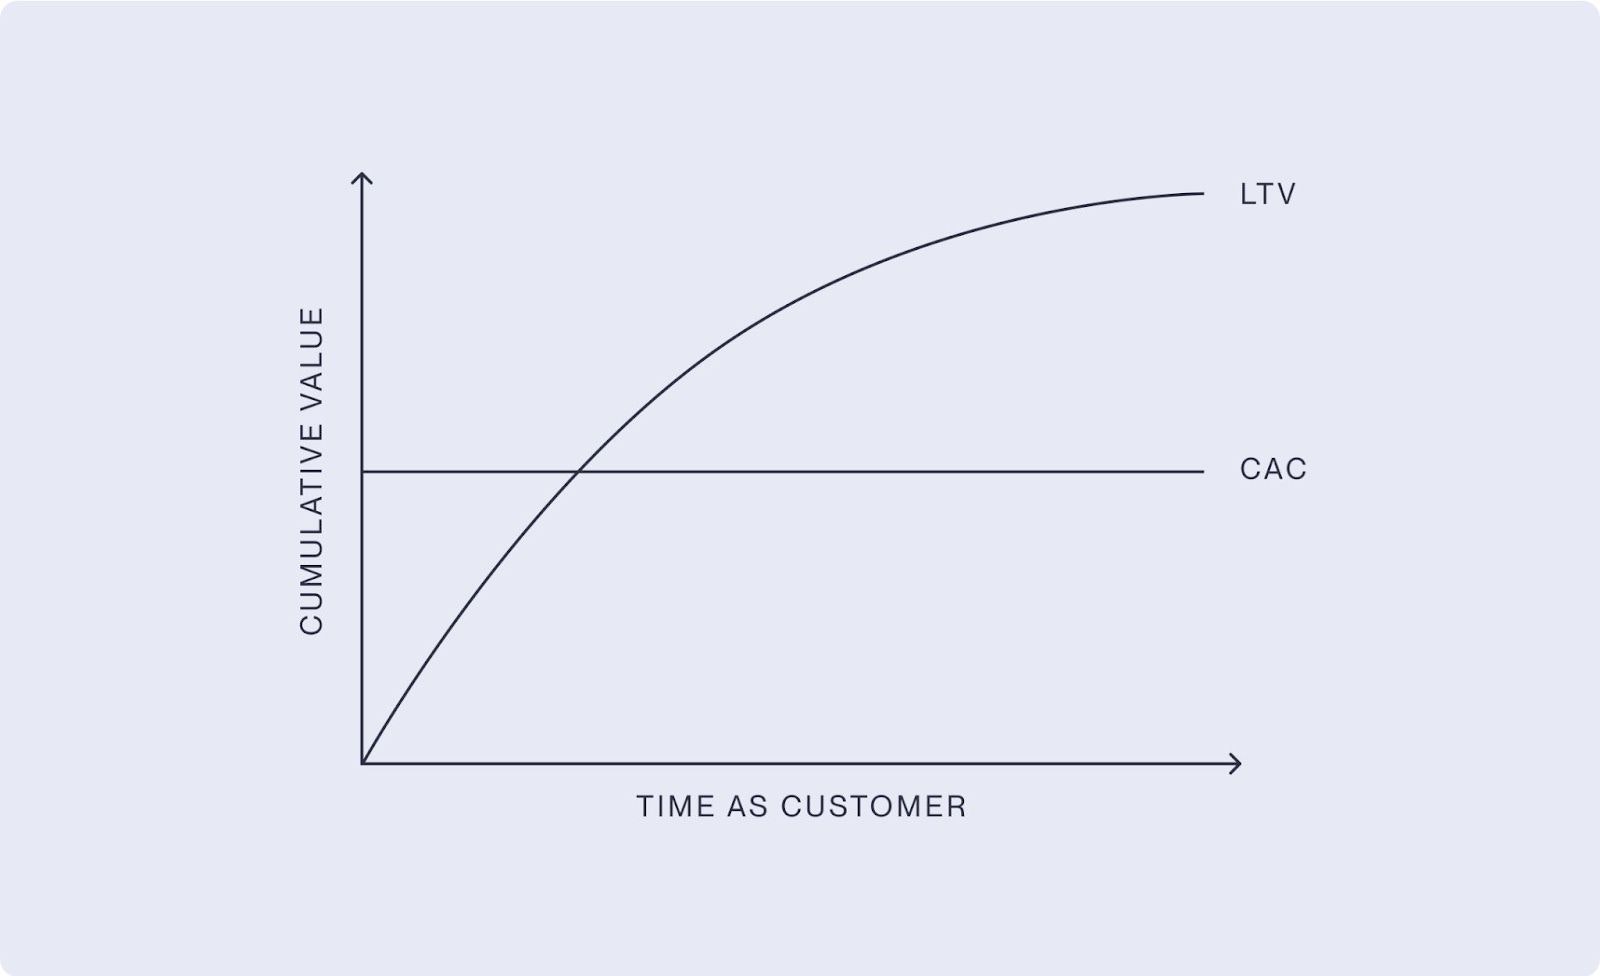
The higher this value is, the more scalable your business is, because a high number indicates that your costs for acquiring customers are outweighed by the value they provide to the business. Conversely, having an LTV/CAC lower than 1 means that you’re losing money on every customer you acquire. This calculation is fundamental to a unit economics analysis, and is also illustrated in the graph below.
LTV/CAC should be measured regularly. We recommend measuring it on a monthly basis, because the factors influencing the data or results of prior periods rarely continue to hold true.
For example, if your company is part of a growing industry, your CAC will likely increase over time as more competitors enter the market. The quality of your customers can also change over time.
Now that we’ve broken down LTV and CAC, we can cover another important metric of a unit economics analysis called payback.
Learn more about reducing your customer acquisition cost.

Payback
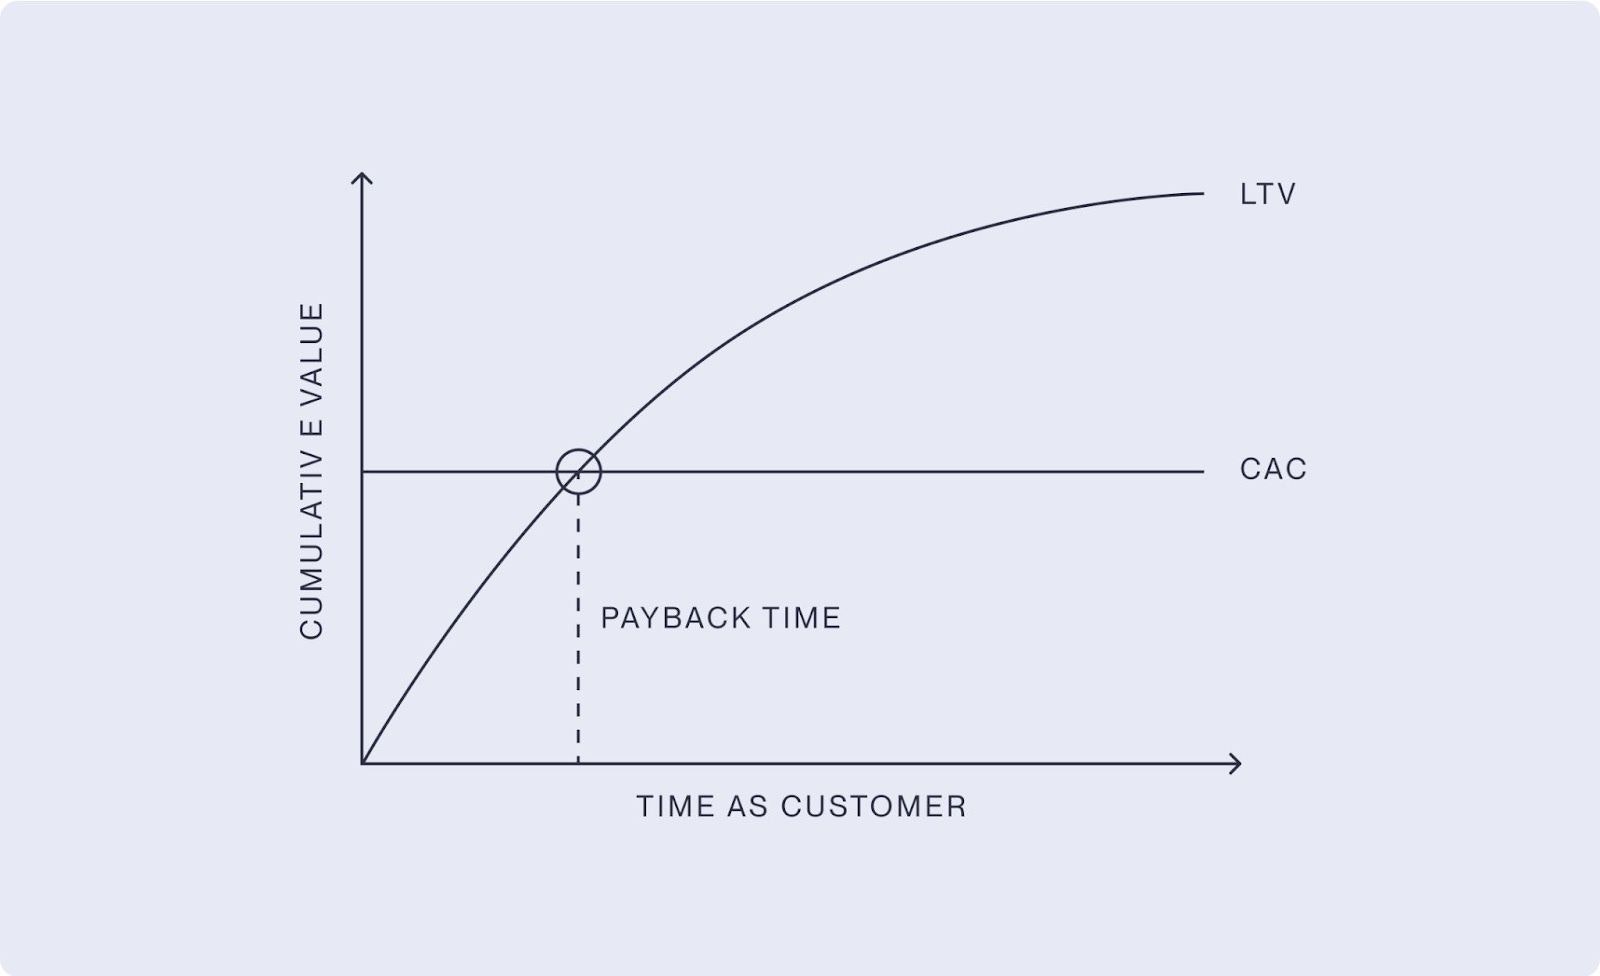
Payback refers to the length of time it takes for the profits you make from a given set of customers to meet the costs you incurred in acquiring them.
Advanced SaaS unit economics metrics
For SaaS startups, a few additional metrics can deepen your understanding of unit economics beyond LTV, CAC, and payback period.
Gross margin per customer lifespan (GML)
GML measures the gross profit you expect to earn from a single customer over their entire relationship with your company. It starts with your gross margin and layers in how much revenue that customer generates over time. In other words, it helps you answer: “How much profit do we actually make per customer, after direct costs, over their lifetime?”
Retention rate
Retention rate is the percentage of customers who remain active over a given period. Because retention directly affects customer lifetime, even small improvements in retention can meaningfully increase LTV and improve your unit economics.
Discount rate
When you forecast cash flows several years into the future, you’ll often apply a discount rate to account for the time value of money and risk. A higher discount rate makes distant cash flows less valuable, which can lower your calculated LTV and make your economics look less attractive on paper.
Cost per feature
Cost per feature looks at how much it costs to build, run, and maintain a specific feature (for example, infrastructure usage, support, and ongoing development) relative to how often customers use it or how much revenue it drives. Tracking cost per feature helps you understand which features are profitable and which may be dragging down your unit economics.
Payback period
Payback period measures how long it takes the gross profit from a customer to “pay back” what you spent to acquire them. Any profit you make beyond the payback point will help you build a growing profit base over time. It’s a key bridge between unit economics and cash flow planning.
A long payback period signifies that your business will be much more cash-intensive. In other words, it will burn comparatively more cash as it’s growing. Conversely, a short payback period — where what you make off of customers quickly makes up for any acquisition costs — doesn’t require as high of a cash balance for funding business growth.
A good benchmark for payback is less than 12 months, but this really depends on your business and the expected arrival of customer value over time. If you have a payback period of 12 months but have very poor retention post-12 months, 12 months isn’t a good benchmark for your business. This is also an indication that you need to start driving higher retention, customer value, and/or lower CACs (ideally, all three). Assessing your LTV/CAC metric in conjunction with payback can provide you with a more balanced view of your business, your cash flow model, and what, if anything, needs to change.
What does "good" unit economics look like for a startup?
With all of these details and nuances in mind, a simple way of understanding your startup’s unit economics is the superficial relationship between your customer lifetime value (LTV) and customer acquisition cost (CAC). If your CAC is less than your LTV, your business is in a strong position. If these two metrics are equal, your business is likely stagnant. If your CAC is greater than your LTV, you do not currently have an economically viable business model. This could mean one of two things: 1) that you need to make adjustments to your business model in order to avoid further financial losses, or 2) that you will need to rely on external financing for the foreseeable future.
It is commonly said that 3:1 is a strong LTV/CAC ratio, where your startup makes 3x as much from each customer as it spends on acquiring that customer. If your ratio is much higher — like 6:1, for example — you may be losing out on growth opportunities. So, if we consider this in the context of fundraising, for example, investors may be hesitant about backing a company with a low LTV/CAC ratio, while a strong LTV/CAC ratio (even a high one) serves as a clear indicator that your startup has great potential for growth.
Stage-specific benchmarks for LTV/CAC and payback
Benchmarks will always depend on your market, ACV, and go-to-market motion, but many investors still use a few rough rules of thumb when they evaluate unit economics:
- Early-stage / seed: At this stage, investors expect your LTV/CAC and payback period to be in motion rather than perfect. You may still be experimenting with pricing, product, and channels, so LTV/CAC can be closer to 1–2x as long as there is a clear path to improving it and strong evidence of product-market fit.
- Series A and beyond: By the time you raise a larger round, investors generally want to see more efficient, repeatable economics. Many look for LTV/CAC in the 3:1 or better range, alongside a payback period of roughly 12–18 months or less, depending on contract size and sales motion.
- Growth stage: Later-stage companies are often expected to sustain LTV/CAC in the 3–5x range while continuing to improve payback and expand net revenue retention, especially if they are pursuing efficient growth over pure top-line expansion.
None of these thresholds are hard rules, but they give you a sense of what “good” looks like as you move from experimentation into scaling.
When unit economics break in the real world
Sometimes it’s easier to spot bad unit economics than good ones. Here are two examples of what that looks like:
Over-leveraged CAC with high churn
Imagine a SaaS company that spends heavily on paid ads and outbound sales, pushing CAC higher every quarter. On the surface, revenue is growing quickly, but customers churn after a few months. LTV stays low, payback stretches well beyond a year, and the company needs more and more capital just to maintain growth. In this scenario, the problem isn’t just marketing spend; it’s a combination of overextended CAC and weak retention that makes the economics unsustainable.
Freemium growth without margin clarity
Another example is a product-led startup that leans heavily on a freemium model. Free users grow quickly and conversion to paid looks promising, so the team continues to invest in product and infrastructure. But because they haven’t carefully measured gross margin per customer, cost per feature, or support and infrastructure costs at scale, they later realize that many paid users are on low-priced plans that don’t cover their marginal cost. Growth masks the issue in the short term, but the underlying unit economics don’t support healthy long-term margins.
Both scenarios underline the same lesson: Topline growth can look impressive while unit economics quietly signal trouble.
Why do unit economics matter for startups?
Unit economics is useful for startups at all stages, but it is especially important for early-stage startups. Unit economics can help you understand if your business will be viable at scale, how to deploy capital effectively, and if your product is well-suited for the current market. Here are a few ways that regular unit economics analyses can play an important role in providing your team with the data points you need for both short- and long-term success:
Unit economics can provide clear insights on your business model
A unit economics analysis provides a clear picture of whether the money you’re spending to acquire a customer is returning any marginal profit — and if so, how fast you’re seeing a return on the costs of acquiring that customer. Ultimately, understanding these details will help you determine if your business is economically sustainable — and if it isn’t, what you’ll need to do to make it sustainable.
In fact, unit economics is a key tool in continuing to iterate and optimize your business model. As mentioned above, there are multiple layers to unit economics analyses. Looking at total metrics is definitely helpful, but narrowing your analysis — by performing individual unit economic analyses per customer segment, for example — can help you refine the inner workings of your business and better understand which customer segments provide the highest returns compared to the cost of acquiring them.
Unit economics can enhance your cash management strategy
If you’re able to predict how many months of revenue you’ll need to break even or exceed your CAC, you can do a better job of projecting your cash flow. This can also help you predict how long you’ll need to rely on external funding, as well as help you determine your organization’s budgets. Breaking down cost structures and revenue predictions can position your company to maintain profitability and fund growth.
Unit economics can help improve your product
Your startup’s unit economics can indicate whether your product is overpriced or undervalued. If the money you spend to acquire one customer is not providing an adequately high return on your investment, there is probably room for product optimization. In a similar vein, unit economics can help you to understand how viable your product will be at scale.
Your startup’s unit economics can indicate whether your product is overpriced or undervalued.
It’s never too late to conduct a unit economics analysis, but the sooner you begin tracking your startup’s unit economics, the better. You may already have a general idea of what your startup’s unit economics look like, but clear, referenceable data helps drive decision-making and sends a positive message to investors.
A comprehensive and evolving bird’s-eye view into the viability of your business model also allows you to be more nimble and informed in the face of changing market conditions, varying demand, and potential pivots.
Frequently asked questions (FAQs)
How do unit economics differ between SaaS and ecommerce businesses?
For SaaS businesses, unit economics usually focus on a customer as the unit and emphasize recurring revenue, retention, and long-term lifetime value. For ecommerce businesses, the analysis often starts with contribution margin per order — revenue per order minus variable costs — and then layers in repeat purchase rate and average order value. Both models look at profitability on a per-unit basis, but SaaS economics hinge more heavily on retention and subscription dynamics.
How do investors use unit economics in fundraising decisions?
Investors use unit economics to understand whether your growth is scalable and capital efficient. Metrics like LTV, CAC, LTV/CAC, and payback period help them see if each incremental dollar of spend brings back enough value. Strong unit economics suggest that additional capital can accelerate growth rather than just fund ongoing losses.
What role does churn play in unit economics?
Churn directly reduces customer lifetime, and therefore LTV. Even small increases in churn can dramatically shrink LTV and weaken your LTV/CAC ratio. For recurring revenue businesses, improving retention (and, ideally, net revenue retention) is often one of the most powerful levers for improving unit economics.
Can unit economics be negative and still attract investors?
Yes, especially at the very early stages. Pre-seed and seed investors may back a company with negative or unproven unit economics if they see strong product-market fit, fast learning cycles, or a clear path to improving LTV, CAC, and retention. However, negative unit economics are not sustainable in the long run; by the time you’re raising larger rounds, investors usually expect a credible plan for reaching healthy LTV/CAC and payback benchmarks.
How do fixed and variable costs impact unit economics?
Unit economics typically focus on variable or marginal costs — the costs that scale as you acquire and serve more customers. Healthy unit economics mean each additional unit generates enough gross profit to cover those variable costs and eventually contribute to fixed costs like salaries, rent, or core infrastructure. As you scale, strong unit economics allow fixed costs to be spread over more revenue, improving overall profitability.
How does pricing strategy influence unit economics?
Pricing directly shapes revenue per unit and LTV. Moving from underpriced plans to value-based pricing, creating higher-ARPU tiers, or packaging features more thoughtfully can all improve LTV and contribution margin. The right pricing strategy balances customer value, competitive positioning, and your cost structure so that each unit generates attractive gross profit.
What benchmarks do investors consider for LTV/CAC and payback period?
A commonly cited benchmark for SaaS is an LTV/CAC ratio of around 3:1 or better, with some high-performing companies reaching 3–5x. Payback periods of under ~12 months are often viewed as strong, particularly at scale, though what’s considered “good” can vary by ACV and business model. These benchmarks aren’t strict rules, but they help investors quickly gauge the efficiency of your growth.
How can startups improve poor unit economics?
If your unit economics are weak, you can pull several levers:
- Increase revenue per customer through better pricing, packaging, or cross-sells.
- Improve retention so customers stay longer and LTV increases.
- Reduce CAC by focusing on higher-quality channels or improving conversion.
- Lower COGS and marginal costs through operational efficiencies or vendor negotiations.
Often, the most durable improvements come from a combination of better product-market fit, smarter pricing, and more targeted acquisition.
What tools can help track and analyze unit economics?
In the earliest stages, a well-structured spreadsheet is often enough to track LTV, CAC, payback, and contribution margin. As you scale, teams typically add a mix of:
- Product analytics tools to understand usage, retention, and feature adoption.
- Business intelligence or FP&A tools to model LTV, CAC, and cash flow across segments.
- Finance and billing systems that surface revenue, cost, and cohort data in a consistent way.
The specific tools matter less than having reliable data and a recurring habit of reviewing your unit economics.
To learn more about the costs of launching a startup, read our 2025 survey-based report “The new economics of starting up.”
About the author
CFO at Mercury.
Share article
Related reads

The solopreneur’s guide to getting your first users

The hidden work behind every “overnight” AI startup

How to find investors for your small business